Consequences of Climate Change: A Skeptical Account
All societies face the coordination problem: In order to do anything
complicated you have to get millions of people to coordinate their activities.
To make pencils you need wood. To harvest wood you need saws To make saws you
need steel. To make steel, you need iron and carbon. To make iron you need iron
ore and coal. To mine coal …
There are two solutions to the coordination problem. The obvious one is hierarchy,
centralized coordination, somebody at the top telling everyone else what to do.
That can work for a very small group of people, a football team or a small
firm, but it scales badly. As the number of people being coordinated increases
it becomes harder and harder for the person at the top to figure out what
everyone should do, know what everyone is doing and make them do it, more and
more likely that the person at the top, separated by many layers from the
people he is supposed to be serving, will base his decisions on his interests
rather than theirs. At the scale of a country it works catastrophically badly,
as demonstrated by, among other things, the collapse of the Soviet Union.
The solution that scales is the decentralized one. Everything belongs to
someone. Each person decides what to do with himself and his stuff. People
coordinate through the market, with prices signaling whether more or less of
something should be produced. If there is not enough iron ore for the steel for
the chain saws to cut down the trees to make the pencils and for everything
else steel goes into, the price of iron ore goes up, giving miners an incentive
to mine more, users an incentive to use less.
In order for this to work, to successfully coordinate people, things have to
somehow be set up so that it is in each individual’s interest to make the right
decision for his part of the problem, the decision that takes account of its
effect on everyone else. That cannot be done perfectly but a market system can
do it surprisingly well. In order to produce things I have to pay my workers
enough so that working for me is at least as attractive as whatever else they
could do with their time, pay for my inputs at least as much as they cost to
produce or are worth to other people. Selling what I produce transfers the
benefit of producing it back to me, so both costs and benefits go into my
calculation of what to do. If benefit is greater than cost it is in my interest
to do it and in our interest for it to be done. Individual decisions add up to
the right group decision. And the decentralized solution scales up to the size
of a global economy.
That is a very sketchy description of what takes a year of price theory or a
book-length equivalent
to fully explain.
The mechanism works for voluntary transactions since you won’t sell me your
labor or your goods unless I pay at least what they are worth to you. It does
not work for involuntary transactions.
You are running a steel mill. To get iron ore, you have to pay someone
enough to cover the cost of mining it. To turn it into steel, you have to pay
workers enough so they are willing to work for you. Unfortunately, your mill
also produces sulfur dioxide, making people who live downwind of you cough.
Since that is a cost for them but not for you it gets left out of your
calculation of how much steel to produce, how to produce it, what price to sell
it for. You might find making steel profitable even if the total cost,
including the cost born by downwind neighbors, was greater than the value of
the steel to your customers.
For other examples, consider a college student playing loud music when other
students in the dorm want to sleep, an airplane rattling the windows of houses
below the flight path as it comes in to land, someone with a cold — or Covid —
going to a party. A sufficiently wise government might be able to fix the
problem, get us back to a system where things are done if and only if they are
worth doing, by appropriate regulations, but doing that is hard because it
replaces the decentralized market system that scales with a centralized command
system that doesn’t. Most of the time, for the minor externalities associated
with many ordinary activities, it is not worth doing. For larger externalities
it might be. Or might not — knowing what should be done is not always easy.
Consider two issues that have gotten a lot of attention in my lifetime.
Sixty years ago population growth played the same role in popular discourse
that climate change does now, the impending catastrophe that, in the view of
almost everyone who mattered, required drastic action to prevent. The
Population Council, a private organization concerned with population issues,
asked me to write a piece on population growth looking at the issue from the
standpoint of someone generally in favor of the market system.
The question as I saw it was what externalities were associated with the
decision to have a child, so I tried to estimate them. My examples so far have
been negative externalities, costs produced by one person’s actions that
someone else has to bear, but there are also positive externalities, benefits
rather than costs. If a student in the dorm room next to mine plays music I
like when I am trying to fall asleep that is a positive externality — I like to
fall asleep to music. Basic research in medicine produces a positive
externality in the form of knowledge of how to cure diseases. When I repaint my
house I produce a positive externality for my neighbors, who get a better view
out of their windows. If my action produces a negative externality I may do it even
when, considering all costs and benefits, it is not worth doing. If it produces
a positive externality I may fail to do it even when it is worth doing.
What if the same action produces both positive and negative externalities?
Your child may become a criminal and impose costs on my children. He may become
a novelist or musician and produce works that my children enjoy. He will
probably go to a public school, imposing costs on the taxpayers who pay for it,
but after he graduates he will pay taxes for the school he is no longer going
to, reducing the cost to other taxpayers. He will produce a wide variety of
costs and benefits for other people.
The conventional wisdom of the time looked only at the costs and concluded
that we would be better off if everyone had fewer children. I tried to look at
both costs and benefits, negative and positive externalities, and add them up.
If costs were much larger than benefits, as most at the time believed, we would
be better off with less population growth than would result from individuals
freely choosing how many children to have, if benefits were larger than costs,
more. The first implies that governments should try to hold population growth
down, perhaps by subsidizing birth control or giving tax benefits to childless
couples or by making it illegal for a couple to have more than one child, as
China did. The second implies the opposite. And if costs and benefits were
roughly equal, making the net externality close to zero, there would be no
reason for governments to interfere in either direction.
I tried to list all of the externalities I could think of and make rough
estimates of their size. My conclusion was that I could not sign the sum, that
the estimates were too uncertain to know whether additional population was, on
net, a good or bad thing.
I published my paper
in 1972 and I still don’t know. What I do know is that the conventional wisdom
of the time was wrong, because it claimed not only that the net externality was
negative but that it was large. The book The Population Bomb,
published by Paul and Anne Ehrlich in 1968, confidently predicted unstoppable
mass famine in the 1970’s, hundreds of millions of people starving to death due
to overpopulation. It sold millions of copies. Not everyone agreed that things
were that bad but almost everyone involved in the controversy agreed that
population growth, if not greatly reduced, was going to be a major problem
making poor countries poorer.
Populations of poor countries continued to grow. Ehrlich’s famine did not
happen. Calories per capita in poor countries went up, not down. Extreme
poverty fell
sharply. That does not prove the net externality was positive — perhaps we
would have been even better off with less population growth. But the effect
could not have been as negative as the expert opinion of the sixties and
seventies claimed since what happened was the opposite of their predictions.
Climate change raises the same question. It too will have both positive and
negative externalities. The question is again whether the net effect will be
positive or negative and how large.
There are two approaches to answering that question. The first is to ask
whether there are general reasons to expect climate change along the predicted
lines, a gradual increase in average temperatures due mainly to increased CO2
in the atmosphere, to have net negative effects. The second is to look at
specific externalities, make some rough estimate of their size, and add them
up.
There is one a priori reason to expect net negative effects from
change: Human activity is optimized against current conditions, making change
in either direction presumptively bad. Farmers grow crops suited to the climate
where they are growing them; a change in climate will require a change in what
they grow and how they grow it. Houses are designed for the climate they are
built in and located in places not expected, under current circumstances, to
flood. Putting it in economic terms, we have born sunk costs based on the
current environment. A change in that environment will eliminate some of the
quasi-rents that we expected as the return from those costs.
This would be a serious problem if we were facing rapid change but we are
not. Global warming so far has been a little over one degree C a century. If
the IPCC projections are correct it is getting more rapid, perhaps several
degrees over the next century — about enough to warm Minnesota to the current
temperature of Iowa. Over a century most farmers will change the crop variety
they grow multiple times for other reasons. If average temperatures are
trending up, those changes will include a shift towards crops better suited to
slightly warmer weather. Over a century, many houses will be torn down and
replaced; if sea level is rising, houses currently built on low lying coastal
ground will be rebuilt a little farther inland — not much farther if we are
talking, as the IPCC estimates suggest we should be, about a rise of only two
or three feet. The presumption that change is bad is a weak one for changes as
slow as those we have good reason to expect from global warming.
At least that is true for humans, who can adapt to change by growing
different crops, adding air conditioning to their houses, moving. Other species
can do it by evolution or by changing their range but that could be a problem
for species such as trees that evolve slowly and shift their range slowly. It
could be a problem for aquatic species adapted to the current pH of the ocean,
since increased CO2 absorbed by the ocean lowers its pH.
There is also one reason to expect the climate change produced by the
greenhouse effect to make us better off. More warmth is generally a good thing
when you are cold, a bad thing when you are hot. Due to the physics of the
greenhouse effect,
it warms cold times and places more than hot, raises the temperature of winter
more than summer, of the polar regions more than the equator.
It is hard to see any other a priori reason to expect climate
change to make us better or worse off. The earth and its climate were not
designed for our convenience, so there is no good reason to believe that their
current state is optimal for us. We are not designed for the current climate —
over our species history, climate has varied by considerably more than the
changes being predicted for global warming. Currently, humans live and prosper
over a range of climates much larger than the range that we expect the climate
at any particular location to change by.
That brings us to the other approach to answering the question, trying to
identify the externalities from climate change and estimate their size. The
question for population was in what ways my having another child makes other
people better or worse off. The question for climate change is in what ways my
doing something that affects climate, such as burning fossil fuels, make other
people better or worse off. The popular discussion of this issue mostly takes
it for granted that all the important effects are negative and their sum very
negative. To see how plausible that is, it is worth sorting effects — negative,
positive, ambiguous — and trying to estimate their size.
There are at least three predictable effects of climate change that appear
unambiguously negative: sea level rise, more frequent extreme heat and stronger
cyclones. There are at least four effects that are unambiguously positive: CO2
fertilization, expansion of habitable areas towards the poles, less frequent
extreme cold, fewer cyclones. There are at least three effects that are
ambiguous, might make us better off, might make us worse off: longer growing
seasons, increased rainfall, reduction in ocean pH.
We do not know enough to put all of these on a single scale, in part because
they have different sorts of costs, but we can at least try to compare positive
and negative effects that produce costs or benefits of similar sorts.
The first step is to specify the amount of climate change being considered.
My estimates are for effects by the end of the century based on IPCC
projections,
about a 3°C increase in average global temperature and one to three feet of sea
level rise, both relative to pre-industrial values. Effects of that are based
mostly on the IPCC reports.
Start with sea level rise. That it will continue to happen is a pretty safe
assumption. How big is the effect?
On average, the U.S. Atlantic coast shifts in by about a hundred feet for
every foot of sea level rise. So a meter of sea level rise, the high end of the
IPCC estimate for the end of the century, shifts the coastline in by about a
hundred meters, less than a tenth of a mile, inconvenient if your house is
located ten meters from the high tide mark but invisibly small on any save a
very large-scale map. The effect will be larger in some places, smaller in
others, depending on the slope of the coastal land. For a more detailed answer,
take a look at the Flood Maps website.
It lets you set the amount of sea level rise then see the effect on the map. It
is not perfect, for reasons some of which are discussed on
the site, but it does let you zoom in on the coastline and get at least a
rough idea of how large the effect of any level of sea level rise is likely to
be.
Compare the map at 0 meters to the map at 1 meter. Even in Bangladesh,
usually offered as a country where sea level rise will be catastrophic, the
effect is almost invisibly small. The same is true for Miami. I have not looked
over the entire world but the only place I could find where a meter of sea
level rise had a large effect was the Nile delta. Another way of looking at the
question is to ask how much land will be lost worldwide due to coastlines
shifting in. My rough estimate is a little more than twenty thousand square
kilometers, about the area of New Jersey.
Compare that to the effect of warming on usable land area. Human land use at
present is limited by cold not, with rare exceptions, by heat; the equator is
populated, the poles are not. As global temperatures increase, temperature
contours in the north shift towards the pole. I estimate the increase in land
warm enough for human habitation at more than ten million square kilometers — a
little less than the area of the U.S. and about five hundred times my estimate
of the loss due to sea level rise. The calculations on which both figures are
based are in Chapter 4 and simple enough that you can check them for yourselves
to see if you find my conclusions plausible.
Decreases in extreme cold and increases in extreme heat can be compared in
terms of their effect on temperature-related mortality. There are two reasons
to believe that the net effect is likely to be a reduction, not an increase.
The first is that, at present, cold-related mortality is much larger than
heat-related — about fifteen times as large globally according to a study
published in Lancet in 2015. The second is that climate change is
projected to increase minimal temperatures in cold regions by substantially
more than maximal temperatures in hot regions. Authors of the Lancet studies
argue that, despite those effects, warming is likely to increase net mortality;
some of the same authors, using the same approach, found that warming so far has
reduced it. I discuss that literature in Chapter 7.
Increasing the concentration of CO2 substantially increases the
yield of many, but not all, crops — the major exception is maize — and reduces
the need of all crops, including maize, for water. That is probably the reason
that, according to the latest IPCC report, the globe is greening, the total
area of vegetation increasing. Doubling the concentration of CO2,
about what the IPCC projects for the end of the century, should increase the
yield of most crops by more than twenty percent, more for crops currently
constrained by a limited supply of water.
There are three possibly negative effects for which I have so far been
unable to come up with estimates. Decreasing ocean pH
is a predictable result of more CO2 in the atmosphere and can
be expected to have effects on some aquatic life; I have not seen any plausible
estimates of the size or sign of the net effect but it is unlikely to be very
large given that ocean pH has apparently been significantly lower as recently
as nine thousand years ago. Making cyclones a little stronger and a little less
common will have both positive and negative effects. So will changes in weather
patterns, probably an increase in both total rainfall and the frequency of very
heavy rainfall. More rainfall means more water to fill reservoirs and feed
crops, more heavy rainfall may lead to more frequent floods. In addition to
these predictable effects there are a variety of others, both positive and
negative, that might happen but cannot be predicted to happen.
My conclusion, as in the case of population, is that the size of the
externalities is too uncertain to sign the sum, to tell whether the net effect
of climate change is to make us better or worse off. That is not the current
orthodoxy. When you finish the book you can decide for yourself whether you
agree.
The argument for doing drastic things to prevent global warming has two
parts. The first has to do with reasons to think that the earth is getting
warmer and that the reason is human action, primarily the production of CO2.
The second is the claim that changes we have good reason to expect if we do not
take appropriate action to prevent them will have very bad consequences for us.
Much of the criticism I have seen of the argument has to do with the first
half, with critics arguing that the evidence for global warming, at least the
evidence that it is caused by humans and will continue if humans do not mend
their ways, is weak. I do not know enough to be certain that those criticisms
are wrong; climate is a very complicated and not terribly well understood
subject and the issue has become badly politicized.But my best guess from watching the debate
is that the first half of the argument is correct, that global climate is
warming and human action is an important part of the cause. What I find
unconvincing is the second half of the argument, the claim that climate change
we have good reason to expect would have catastrophic consequences for humans.
Obviously one can imagine climate change large enough and fast enough to be
a very serious problem — a rapid end of the current interglacial, for example.
If, as I believe is the case, climate is not very well understood, one cannot
absolutely rule out such changes either caused or prevented by anthropogenic
warming. There is some evidence, discussed in Chapter 19, that the reason the
next glaciation has not started yet is anthropogenic warming, not current
warming due to the industrial revolution but warming that started some seven or
eight thousand years ago due to the invention of agriculture. But most of the
argument is put in terms not of what might conceivably happen but of what we
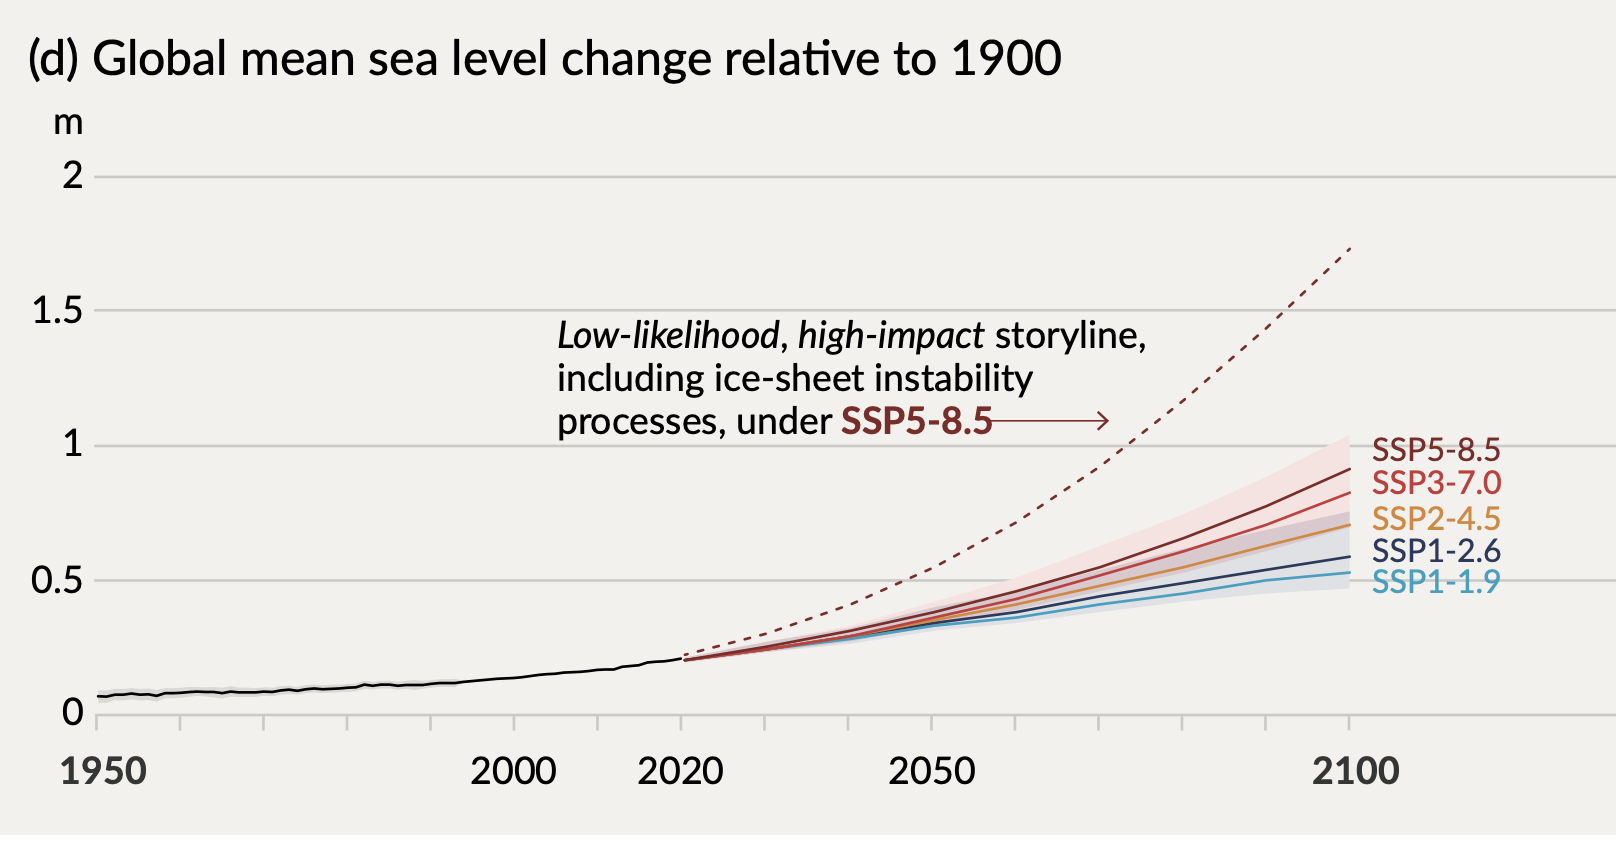
have good reason to expect to happen. I think the outer bound of that is
provided by the IPCC models.
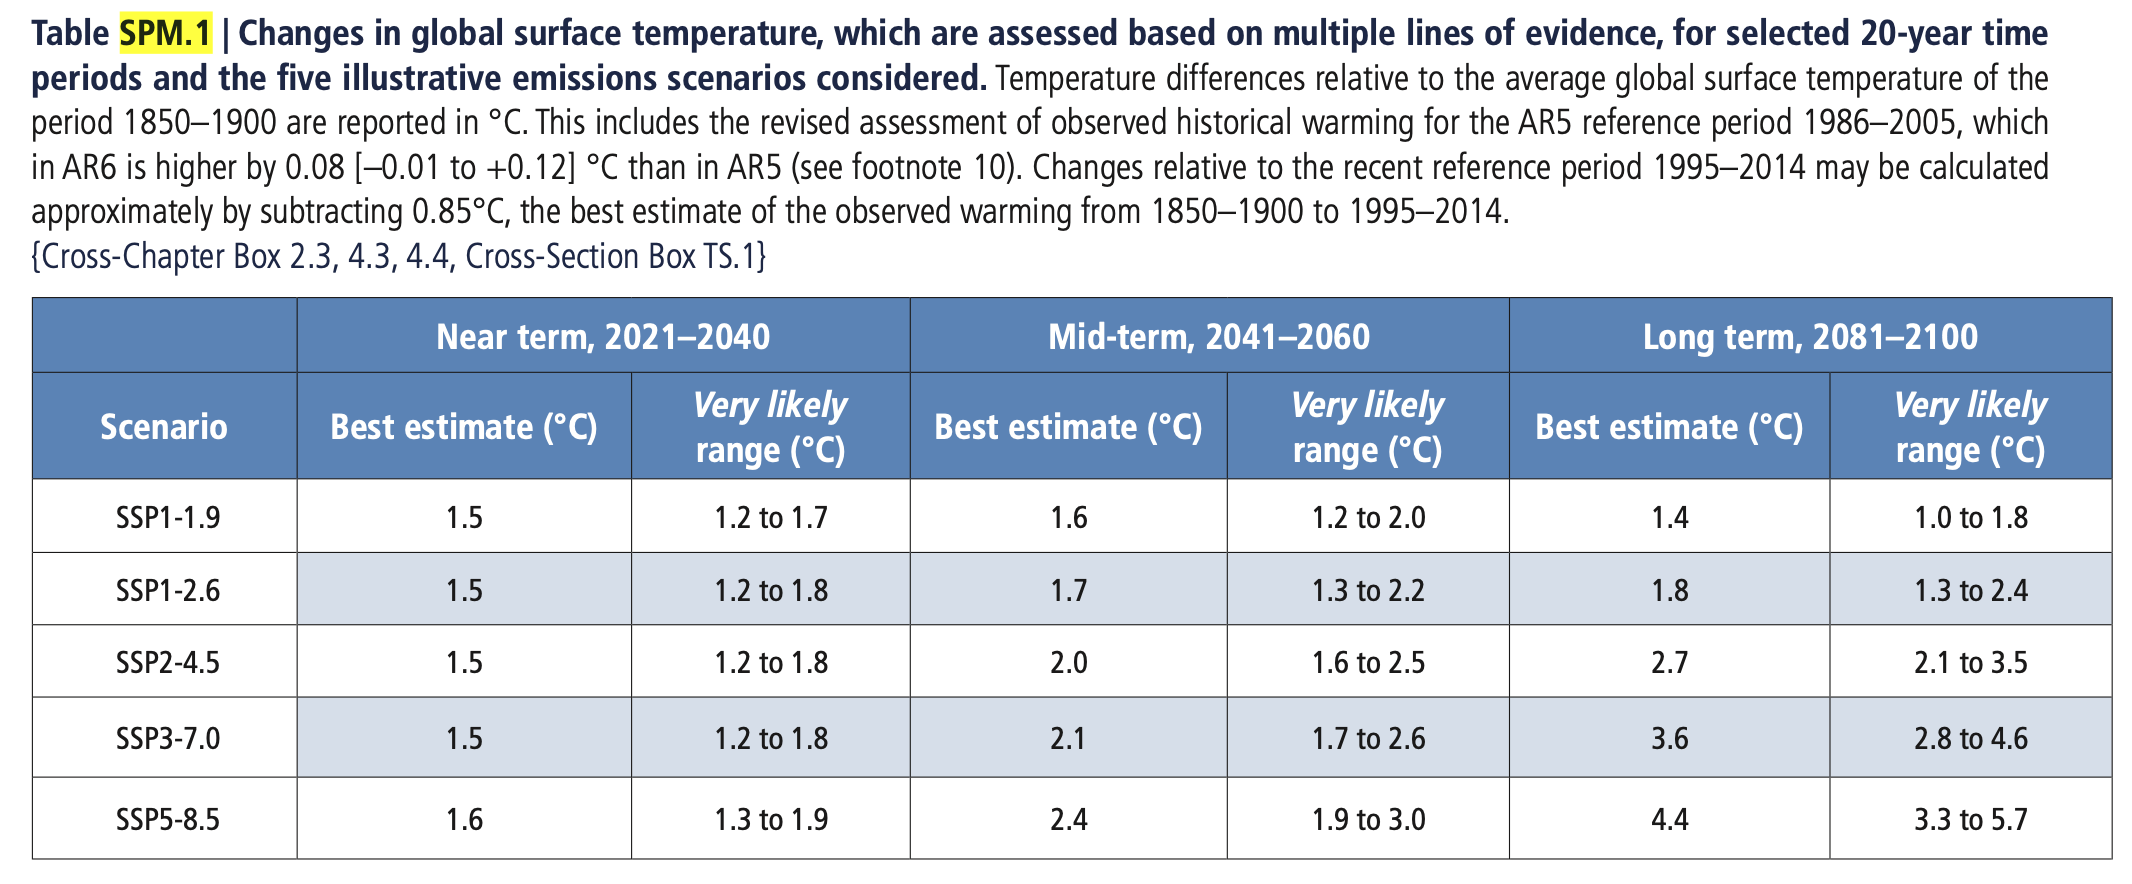
Figure SPM.8
(PCC_AR6_WGI_SPM.pdf)
IPCC, 2021: Summary for Policymakers. In: Climate Change
2021: The Physical Science Basis. Contribution of Working Group I to the Sixth Assessment
Report of the Intergovernmental Panel on Climate Change, Cambridge University
Press,
doi:10.1017/9781009157896.001.
How serious are the projected changes? Comparing a map of global
temperature to a map of population
density shows densely inhabited regions with average temperatures from
about 10°C to about 30°C, with some of the most densely inhabited regions at
the high end of the range. I could find no empty areas that are hotter than all
populated areas, hence no areas that are depopulated only because of how hot
they are. If people can currently live, work, grow crops over a temperature
range of twenty degrees it is hard to see why most of them could not continue
to do so if average temperature shifted up by two or three degrees, with a
century to adjust to the change.
There are several ways that the claim of catastrophic consequences might be
defended. One is some argument to show that present arrangements are optimal,
that any deviation can be expected to make things worse. That claim is implicit
in some of the rhetoric but I have never seen anyone actually state and defend
it.
Another is that, while changes to be anticipated over the next century will
not produce catastrophe, changes over a longer period will.
If we burned all the coal, oil and gas that’s left in the
ground, we’d melt Antarctica and global sea levels would rise as much as 60
meters (200 feet) over the next ten thousand years. Coastal cities from New
York to Shanghai would wind up deep underwater. (One
of multiple news stories reporting on a journal article.)
If that happened today, even by the end of the century, it would indeed be a
catastrophe, but ten thousand years is long enough to make any description of
what humans will be doing and able to do that far into the future a wild guess.
No city on Earth is that old.
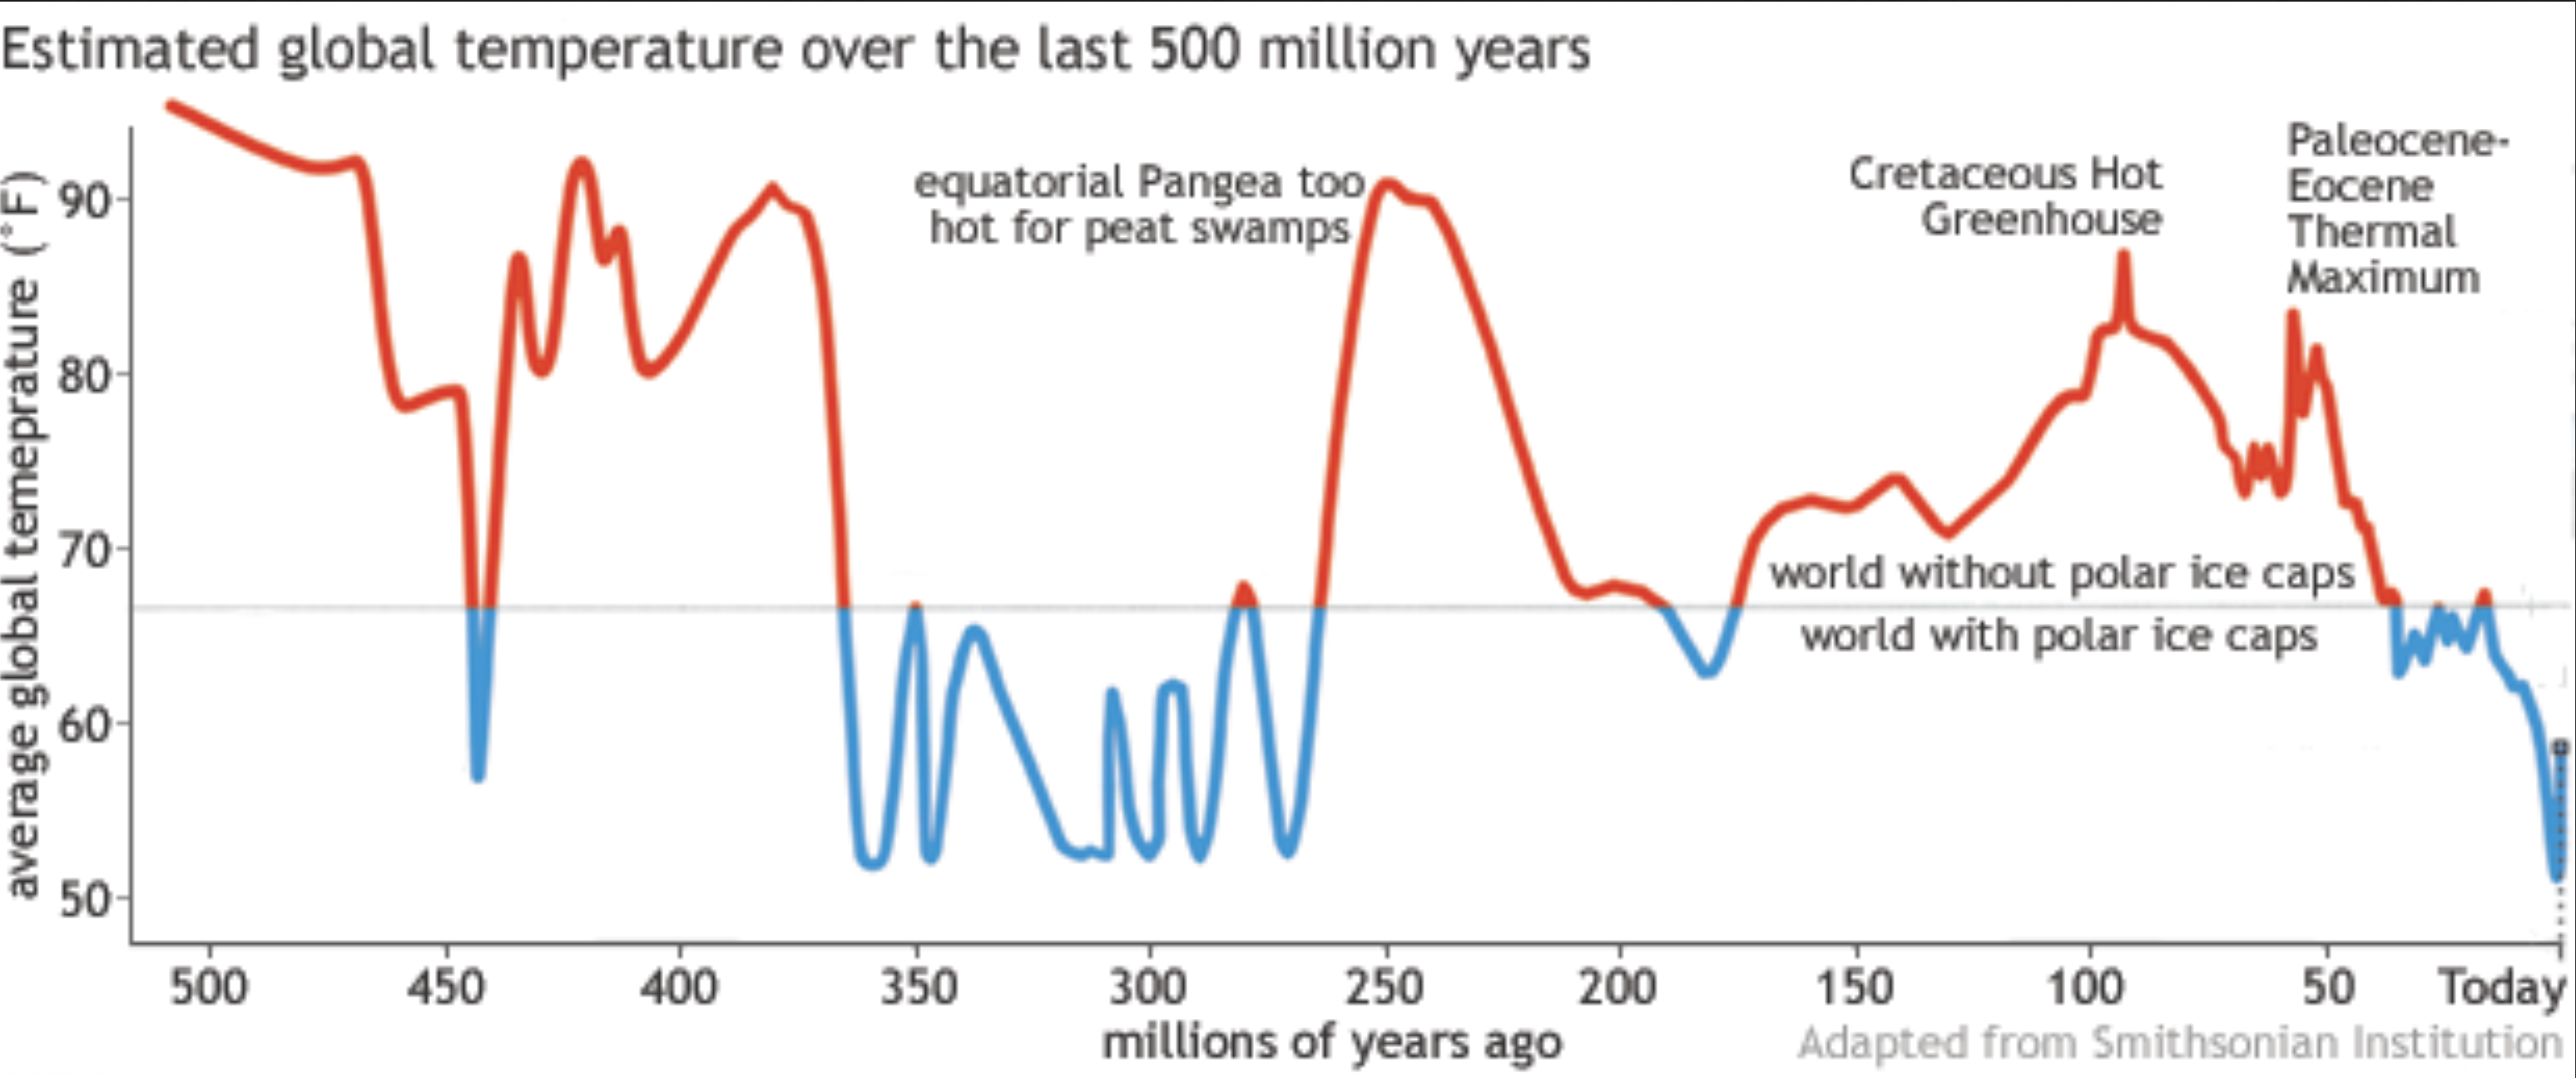
A different version of the catastrophist argument is the claim that climate
is unstable, that an increase of a few degrees could trigger a much larger
increase. That might be plausible if current temperatures were so high that
additional warming would raise them above any in the past. But although present
temperatures may well be higher than any in the past two thousand years, as
discussed in an Chapter 13, the Earth is much more than two thousand years old.
The graph below shows estimated global temperature over the past five
hundred million years. While present temperature is high relative to the recent
past it is cool relative to the more distant past, more than thirteen degrees
below the high of the past hundred million years. We are currently in an ice
age, defined by geologists as a period when there is an ice cap on one or both
poles. For most of the past five hundred million years there wasn’t.
 The claim that we have good reason
to expect climate change on a scale that will produce not merely problems for
some but catastrophe for many is, I believe, one that no reasonable person
should take seriously. Most of the rest if this book will be concerned with a
more modest claim, that the net cost of climate change would be large enough to
make it worth bearing substantial costs to reduce it.
The claim that we have good reason
to expect climate change on a scale that will produce not merely problems for
some but catastrophe for many is, I believe, one that no reasonable person
should take seriously. Most of the rest if this book will be concerned with a
more modest claim, that the net cost of climate change would be large enough to
make it worth bearing substantial costs to reduce it.
If I am right, why does almost everyone else believe that climate change is
a terrible problem? The first answer is that they don’t. If you look at expert
opinions such as the IPCC reports or the work of William Nordhaus, an economist
who received a Nobel prize for his work estimating the cost of climate change,
you discover that they view climate change as undesirable but not as the
catastrophe that much of the public discussion implies. Nordhaus writes that
“the best guess in this book is that the economic damages from climate change
with no interventions will be on the order of 2.5 percent of world output per
year by the end of the twenty-first century” (A Question of Balance,
p. 6). That is in a model in which per capita consumption roughly
triples by then. So the difference between the world without climate change and
the world with climate change is, by his model, the difference between per
capita income by 2100 being 300% of its current level its being 292.5%.
Competent authorities, as in that example, do not view climate change as
catastrophic but they do view it as a bad thing. Why?
Part of the answer is that with a question that complicated, where you are
summing large positive and large negative terms, any calculation of net effects
depends on multiple judgement calls: how large and how likely you think each
effect, how hard you look for possible effects. Nordhaus, for example, includes
estimates of very low probability high cost outcomes, things that probably
won’t happen but conceivably could, in his estimate of expected cost. As best I
can tell he has made no effort to include very low probability high benefit
outcomes of climate change, of which the most obvious is holding off the next
glaciation.
Sometimes the bias is worse than that. Rennert et. al. 2022, published in Nature and discussed in Chapter 11, estimated
the net negative effect of an additional ton of Carbon dioxide at $185, more
than three times the number that the EPA had been using for regulatory
decisions. The article adds up estimated costs from now to 2300. Most of those
costs depend, among other things, on technology — the effect of heat on
mortality, the source of about half the cost, depends among other things on
medical technology, the effect of climate change on crop yields depends on
biotech, other costs depend on other technologies.
Rennert sums costs over the next three centuries, with about two-thirds of
the total coming after 2100. Their solution to the problem of predicting
technological change over that period is, with the exception of their estimates
of CO2 production and energy costs, to ignore it, implicitly to
assume technological stasis. No medical progress for the next three centuries.
If you are looking at a complicated problem with a lot of judgement calls
and know what conclusion you want to reach, you can usually reach it. Most of
the people working on climate change know that the respectable position, the
one that will get their articles published, their research funded, earn the
approval of their peers, is to be against it. If Rennert had found that the
cost of carbon was less than a third the old value rather than more than three
times I doubt Nature would have published the article or, if it did,
the EPA been interested in it.
A negative externality is a cost that one person’s actions impose on others
without requiring their consent. A positive externality is a benefit that one
person’s actions provide to others where the person producing the benefit
cannot control who gets it, hence cannot charge for it. The existence of
negative externalities is the usual economic argument for taxes, such as a
carbon tax, imposed to discourage activities that produce negative
externalities. Positive externalities provide a similar argument for subsidies.
The theory in either case is to make the private cost/benefit calculation of
the individual taking an action correspond to the social calculation, making it
in the interest of people to take actions that produce net benefits, avoid
actions that produce net costs, with costs and benefits taking account of
effects on everyone.
The problem with external costs is not that they are costs; external
benefits are a problem too. The problem is that they result in individuals
making the wrong decisions, decisions that are optimal for them but not for us.
The size of the problem is not measured by the size of the externality but by
the cost of the wrong decisions. If an externality, positive or negative, does
not affect a decision, if the individual would have made the same decision if
he paid the entire cost and collected the entire benefit, the existence of that
externality changes who benefits or loses and by how much but it does not
change the net benefit, the effect summed over everyone.
Consider a decision where the person making it receives all of the benefit
but pays only 95% of the cost, with the remaining 5% falling on someone else.
If benefit is less than 95% of cost he doesn’t do it and shouldn’t, since doing
it harms both him and us. If benefit is more than 100% of cost he does it and
should, since doing it benefits both him and us. The existence of the
externality, the fact that some of the cost is paid by other people, only makes
us worse off if cost happens to be between 95% of benefit and 100% of benefit,
in which case he does it and shouldn’t. If that happens he makes the wrong
decision but the decision is not very wrong, since benefit is only a little
more than cost.
It follows that the size of the problem created by an externality depends on
more than the size of the externality. If most of the relevant decisions will
get made correctly, the benefit of correcting an externality, even a large
externality, may be small.
Consider the relevance of this to proposals for a carbon tax. If you know
the size of the cost imposed by an additional ton of CO2 — I argued
in the previous chapter that we do not, but for this one I will assume we do —
that is enough to tell you how high the ideal carbon tax would be, since a tax
that exactly transfers the external cost to the person deciding whether to do
something that produces CO2 gives him exactly the right incentive.
Setting up and enforcing a carbon tax is itself costly, however. Someone has
to calculate the cost of CO2, measure how much is being produced by
different people’s actions, collect the tax. There will be additional costs
from people lobbying or litigating over how high the tax should be, trying to
manipulate details of what is taxed and how it is measured, perhaps bribing
inspectors or using political influence to lower the cost on themselves, raise
the cost on their competitors. When something
close to a carbon tax was passed by the house (but not the Senate) in 2009,
the legislation was a compromise between what economists would have recommended
and what politicians thought it in their interest to pass.
An additional cost of a carbon tax is the cost of doing it wrong, using the
excuse of a carbon tax to justify policies that are politically profitable but
impose net costs. For a large real world example, consider biofuels. The policy
was initially proposed as a way of reducing CO2 output by replacing
gasoline with alcohol produced from corn. More careful analysis found that it
didn’t work, that the CO2 produced in the process was at least as
great as would have been produced by burning gasoline instead. We still have the
program because, although it did not reduce CO2 emissions, it did
raise the price of corn, and farmers vote. The US, which is the world’s largest
producer of maize (corn), currently converts more than a third of its output to
alcohol.
If follows that while the optimal size of the carbon tax, or any similar tax
or subsidy, depends on the size of the externality, whether it is worth doing
it at all depends on a more complicated calculation. Even a large externality
might produce costs smaller than the cost of controlling it.
Looking only at what government should do would make sense if we were ruled
by benevolent autocrats, philosopher kings, but we are not. The problems that
prevent individual rationality from generating group rationality, of which
externalities are an example, apply to decision makers in a political system as
well as in a market system. In deciding whether to support a carbon tax the
question is not whether there is some level of carbon tax that would provide
net benefits and what it is but whether the level of carbon tax that would come
out of the political process would make us better off.
As I think I show in Chapter 11, the estimate of the cost of Carbon in
Rennert et. al. 2022 depended on obviously unrealistic assumptions, such as no
progress in medicine for the next three centuries, all of which increased the
calculated cost. Prior to the 2024 election I expected the EPA to recommend
regulations based on that estimate. If the regulations had taken the form of a
carbon tax and if my criticisms of Rennert are correct it would have
been several times too high.
That may now have changed — but not because of things wrong with the
article.
How do I explain a collection of professional scholars producing a
conclusion that depends on obviously unrealistic assumptions and a regulatory
body accepting it?
The authors of Rennert got the benefit of publishing a high profile article
giving a result popular with people who matter to them, most of whom favor
stronger action against climate change. The EPA regulators would have gotten
power for themselves, improved opportunities to get bribes if they are corrupt,
status and promotion if they are not. None of them would bear a significant
fraction of the cost or receive a significant fraction of the benefit of their
decision. Like other people they act in their interest — which is not, save by
accident, our interest. The same is true of the legislators who would vote for
or against the carbon tax.
The voters who elect those legislators will bear costs and receive benefits
of climate policy for their lifetime, longer if we include effects on children
and grandchildren. But finding out whether the law a politician votes for is
good or bad is not costless — no candidate runs as the bad guy — and the
benefit to the individual voter of paying the cost to find out is shared with
the rest of the population, an externality in the U.S. of about 99.9999997%. It
is not surprising that informed voting is under-produced.
It is possible that a carbon tax is desirable. But the test is not whether
there is anything that the government could do that is worth doing. It is
whether what the government would do is worth doing.
Consider the application of the same line of argument to Covid regulation —
lockdowns, mask mandates, and the like. My precautions against catching Covid
produce a positive externality, a reduction in the chance that I would catch it
and pass the infection on to someone else, so I have a less than optimal
incentive to take such precautions. But catching Covid is a substantial cost to
me — before I was vaccinated I estimated about a 3% chance of dying — so it was
in my private interest to take precautions, even if fewer than it was in our
interest for me to take. If I bore half the cost of getting Covid and so
received half the benefit of precautions, it was in my interest to take those
precautions, and only those, whose benefit was at least twice their cost.
If we had philosopher king rulers that would have been a good argument for
letting them require additional precautions but we didn’t. The political actors
who made the decisions, government medical professionals such as Fauci, state
governors, FDA regulators, and the like, bore neither the cost of the
precautions nor of their failure. We will probably never know whether the
policies they set made us better or worse off, but the fact that Sweden, the
one developed country that did not implement such policies, ended up with one
of the lower
figures for excess mortality, suggests that they may have made us worse
off.
Anyone who looks seriously at climate issues should recognize that the
consequences of climate change are very uncertain. My own view is that they are
sufficiently uncertain to raise serious doubts about the sign as well as the
size of the effect, that climate change due to human production of greenhouse
gases might make us better off rather than worse off. My belief that the net
effect of climate change might be positive is consistent with the current
scientific orthodoxy, although I attach a higher probability to the possibility
of net positive outcomes and pay more attention to it than most. Although Rennert
et. al. 2022, discussed in Chapter 11, is in my view badly biased in the
direction of overestimating the costs, its Figure 2
shows a probability distribution for the net cost of carbon some of which is
below zero, representing the possibility of a net positive effect.
Even if I am wrong and the effect is almost certainly negative, how negative
it will be is very uncertain. CO2 emissions might fall sharply due
to increases in the cost of fossil fuels or decreases in the cost of
alternatives. For a given value of emissions, varying estimates of climate
sensitivity imply at least a factor of two range for the resulting temperature
increase. For a given increase in temperature, the effect on humans depends on
what humans will be doing for the next century. The effect of climate on
agricultural output is difficult to predict; Rennert found it large and
negative, one of the previous studies found it positive. Diking against a meter
of sea level change could be a serious problem for Bangladesh if it happened
tomorrow. If Bangladesh follows the pattern of China, where GDP per capita has
increased more than seventy fold since Mao's death, by the time it happens they
can pay the cost out of small change.
One uncertainty that has largely been ignored is uncertainty about features
of the next century and more that are not due to climate change. To take one
example, the Nature article discussed in Chapter 11 finds almost half
the total cost of carbon due to increased mortality from increased temperature.
Mortality, from temperature or almost anything else, depends in part on the
level of medical care. By using past data to relate temperature to mortality
for their calculations the authors, who are summing cost from now until 2300,
are implicitly assuming no medical progress for the next three centuries as
well as assuming no change in heating or cooling technology and no effect of
the increased income in their projections on vulnerability to temperature.
Doing that was wrong, arguably dishonest given that the authors do not
mention the implicit assumptions that go into their calculations, but it is not
clear what they should have done instead. It is tempting to take their figure
as an upper bound, on the theory that technological progress can be expected
to lower mortality, but even if it decreases total mortality it still could
increase the change in mortality due to climate change. If medical progress
reduced mortality from cold much more than it reduced mortality from heat, the
benefit from warming by more than the cost, it would make the net effect of
warming on mortality worse.
Ignoring the effect of technological change on effects of climate change is
one example of the problem, another is ignoring the effect of income growth. An
increased concentration of CO2 in the atmosphere increases crop
yield but alters the mix of nutrients, decreasing the proportion of some
minerals. Whether that
matters depends on how available mineral supplements, common and inexpensive in
developed countries, are in the future. If the present
pattern of economic progress in poor countries continues, very nearly
everybody will be at developed world standards of living in a century, probably
sooner, which should substantially reduce the costs due to climate change. But
there is no guarantee that that will happen; we could have the rate of growth
in world GNP assumed in models of carbon emissions but have most of the growth
in countries already rich.
As I put it almost twenty years ago in a book on future technology:
… with a few exceptions, I have limited my discussion of the future to the next thirty
years or so. That is roughly the point at which both A.I. and nanotech begin to
matter. It is also long enough to permit technologies that have not yet
attracted my attention to start to play an important role. Beyond that my
crystal ball, badly blurred at best, becomes useless; the further future
dissolves into mist. (Future Imperfect)
If the world is changing in ways that cannot be predicted, estimates of
costs in the distant future ought to be heavily discounted for uncertainty,
given little weight relative to costs in the near future. That is a problem
mostly ignored in the climate literature.
Serious estimates of the rate of climate change, such as the IPCC reports
discussed in Chapter 1, show it too slow to have significant effects in the
next few decades: Sea level rise is estimated as half a meter to a meter by the
end of the century, temperature change one or two tenths of a degree per
decade, decline of ocean pH about .017/decade.
I conclude that the next century is sufficiently uncertain so that it makes
little sense to take expensive precautions against risks a century, let alone
three centuries, in the future. By the time the risk arrives we may have
already wiped ourselves out in some other way. If we have not wiped ourselves
out our lives may have changed in a way that eliminates the problem; commuting
via virtual reality produces little CO2. If we and the problem are
still around we are likely to have a level of technology and wealth that will
make possible a range of solutions well beyond what we are currently
considering. All of these are reasons why I think a persuasive case for doing
something about global warming requires evidence, not yet available, of serious
negative effects in the fairly near future.
That may be one reason why people arguing for climate action make inflated
claims about near term effects.
A possible response to this point is to argue that uncertainty is no
argument against action, that one should simply replace the uncertain range of
outcomes with the best estimate one can provide of its expected value, the
average of costs weighted by their probability, and act as if that were the
known consequence of warming.
That sounds right but isn’t, because the question we are answering is not
"what should we do?" but "what should we do now?" Waiting may
raise the cost of dealing with the problem but it will also provide additional
information. The more information we have, the better our ability to decide
what precautions are worth, or not worth, taking. Uncertainty that will be
reduced over time is an argument against immediate action.
The usual rhetorical response is to claim that we barely have time to act at
all, that if we wait more than a very short time it will be too late. This
claim becomes less persuasive the more times it is made, and it has been
made a large number of times over the past thirty years. It largely depends on
picking some arbitrary temperature change, most commonly two degrees C, and
treating it as if it were the end of the world. As salesmen commonly put it,
"Buy Now—This Is Your Very Last Chance To Take Advantage of Our Special
Offer."
For a more realistic opinion, consider an estimate of the cost of waiting by
William Nordhaus, an economist who has specialized in climate issues. In the
course of a piece
arguing for immediate action against climate change, he reported his
estimate of how much greater the cost of climate change would be if we waited
fifty years to deal with it instead of taking the optimal action at once.
The number was $4.1 trillion. He took that as an argument for immediate action,
writing that "Wars have been started over smaller sums." 4.1
trillion sounds like a large number but it is a cost spread out over the entire
globe and a long period of time. Annualized, it comes to less than a tenth of a
percent of world GNP.
"Thought before action, if there is time."
(from a character in a Dick Francis novel)
And there usually is.
I have been comparing a policy of acting today on the basis of our current
estimate of the expected cost of climate change with a policy of waiting until
we have more information and only acting then. There are other alternatives.
Suppose we are uncertain what the cost from an additional ton of CO2
is but are confident that it is at least five dollars. It would follow that any
policy to reduce emissions justified at a cost of five dollars a ton was worth
taking now although we might want to wait for more information before
implementing more expensive policies.
To generalize this approach imagine, as economists often do, that we have
complete information not of cost but of the probability distribution for cost —
not merely, in this case, the probability distribution for the cost of climate
change based on our present information but the probability distribution for
changes in that distribution over time due to additional information. We could
then, in principle, calculate an optimal policy for today, perhaps a modest
carbon tax, and rules for modifying that policy, increasing or decreasing the
tax year by year as additional information came in.
The US has just joined the allies in World War II and you are a government
official with the job of deciding whether batches of ammunition produced for
the war effort are of acceptable quality, whether too many of the rounds are
duds. You consult a statistician who tells you that the correct procedure is to
test a fixed number of rounds, accept or reject according to how many are duds,
with the number tested and the acceptance criteria depending on facts about the
cost of testing, the value of quality, and what you know about how likely
defective batches are.
It occurs to you that that cannot be the right answer. Suppose his formula
tells you that a batch should be rejected if, after testing ten thousand
rounds, more than fifty are defective. If the first fifty-one rounds are
defective there is no point to testing the rest of the ten thousand.
Generalizing the result, what you want is not a fixed number to test and a
fixed criterion for failure but a stopping rule, a way of recalculating your
estimate of the percentage of duds in the batch and your confidence in that
estimate after each round is tested and stopping the tests when you become
sufficiently confident that the batch either is or is not acceptable.
This is a true story, somewhat condensed. The original insight seems to have
been due to Garret L. Schuyler, a captain in the navy, in a conversation with
W. Allen Wallis, head of the Statistical Research Group during the war. It was
followed up by Wallis and my father, which is how I heard the story. They
eventually got Abraham Wald interested. He solved the theoretical problem of
finding a rule for the stopping point and in the process invented sequential
analysis, later described by Wallis as “one of the most powerful and seminal
statistical ideas of the past third of a century.” I have just described the
application of the same approach, continually revising the decision as
additional information comes in, to climate policy.
Nordhaus devotes a chapter of his book to “Dealing with Uncertainty in
Climate-Change Policy.” Unless I missed it, he never mentions the fact that, if
information is improving over time, uncertainty is an argument for delay.
My discussion so far exhibits an error commonly made by economists writing
about policy, the implicit assumption that they are writing for an intelligent
and benevolent despot, that if only they can figure out what ought to be done
the government will do it. For evidence against that assumption in the climate
context, consider biofuels policy. Legal rules to force the conversion of corn
into ethanol to be used as fuel were initially justified on the theory that
substituting biofuels for fossil fuels would decrease the output of CO2.
Academics investigating the question eventually concluded that it didn’t, that
at least as much CO2 was produced in the process of growing corn and
converting it into ethanol as would be produced by burning the equivalent
amount of gasoline. We still have the biofuels policy, still convert more than
a third of the U.S. output of maize, roughly fifteen percent of world
production, into alcohol. Doing so may not slow climate change but it does rise
the price of maize — and farmers vote.
Think of it as our contribution to world hunger.
I spent a good deal of time and effort researching and writing a critique
of Rennert et al. 2022 — Chapter 11 is based on it — arguing that it
greatly exaggerates the cost of carbon, sent a version of that critique to the
EPA, which had asked for comments, another to the authors. I received no
response from either the authors or the EPA, will be pleasantly surprised if my
arguments had any effect on the EPA’s decision of whether to adopt a higher
cost of carbon.
Climate change can affect the amount of land usable by humans in at least
three different ways. Land is lost through sea level rise. Land may be lost
because it becomes too hot for human use. Land is gained because it becomes
warm enough for human use. Exact calculations of the size of all three effects,
if possible at all, would require much more expertise and effort than I am
bringing to the problem. What I offer here are Fermi estimates, numbers based
on very crude approximations. My conclusions could easily be wrong by a factor
of two but are unlikely to be wrong by a factor of ten.
For all three estimates I will be assuming warming of 3°C above current
temperatures and sea level rise of .6 meters above present sea level, a little
more than what the IPCC report projects for the end of the century under
SSP3-7.0.
The amount of land lost equals the length of coastline times the amount by
which it shifts in. For the total length of the world’s coastline I found a figure of 356,000 km. I came across a
figure of a hundred feet of shift for every foot of sea level rise in a book
discussing the situation on the U.S. Atlantic coast; since I do not have
figures for every coast in the world and am not trying to be very precise, I
will use that.
60 m of coastline shift x 356,000 km of coastline = 21,436 km2
That is my very approximate estimate of land lost to sea level rise.
How much does temperature rise in hot parts of the world with 3° more of
global warming? Figure SPM.5b of the latest IPCC report
shows a map of projected average temperature change due to a 4° increase
relative to 1850-1900 in average global temperature, roughly 3° relative to
current temperature; areas on the figure that are both hot and densely
populated appear to warm by a little less than the global average. Table
11.SM.2 shows the effect of different levels of global warming in different
regions on maximum temperatures. It looks from that as though 3° of global
warming would raise the maximum temperature of the relevant regions
by about 3°. If we knew at what temperature, average or maximum, the Earth’s
surface becomes too hot for human habitation, we could conclude that any area
currently within three degrees of that would, with our assumed level of global
warming, become too hot for humans.
The simplest approach to doing this is to compare a map of global
temperature (Figure
1) to a map of population density (Figure
2) and see at what temperature population density goes to close to zero.
Comparing the two maps we observe that while the coldest areas of the globe are
essentially empty, the hottest are not; some, such as the Philippines, Senegal
and Malaysia, are densely populated. If there is a temperature at which the
Earth’s surface becomes unlivable, these maps do not show it. I do not have a
detailed enough temperature map to estimate the area within 3° of the highest
current temperature, where it is at least possible that warming might make land
uninhabitably hot, but since I have no evidence of any area too hot for
habitation I will tentatively take the area that is as zero.
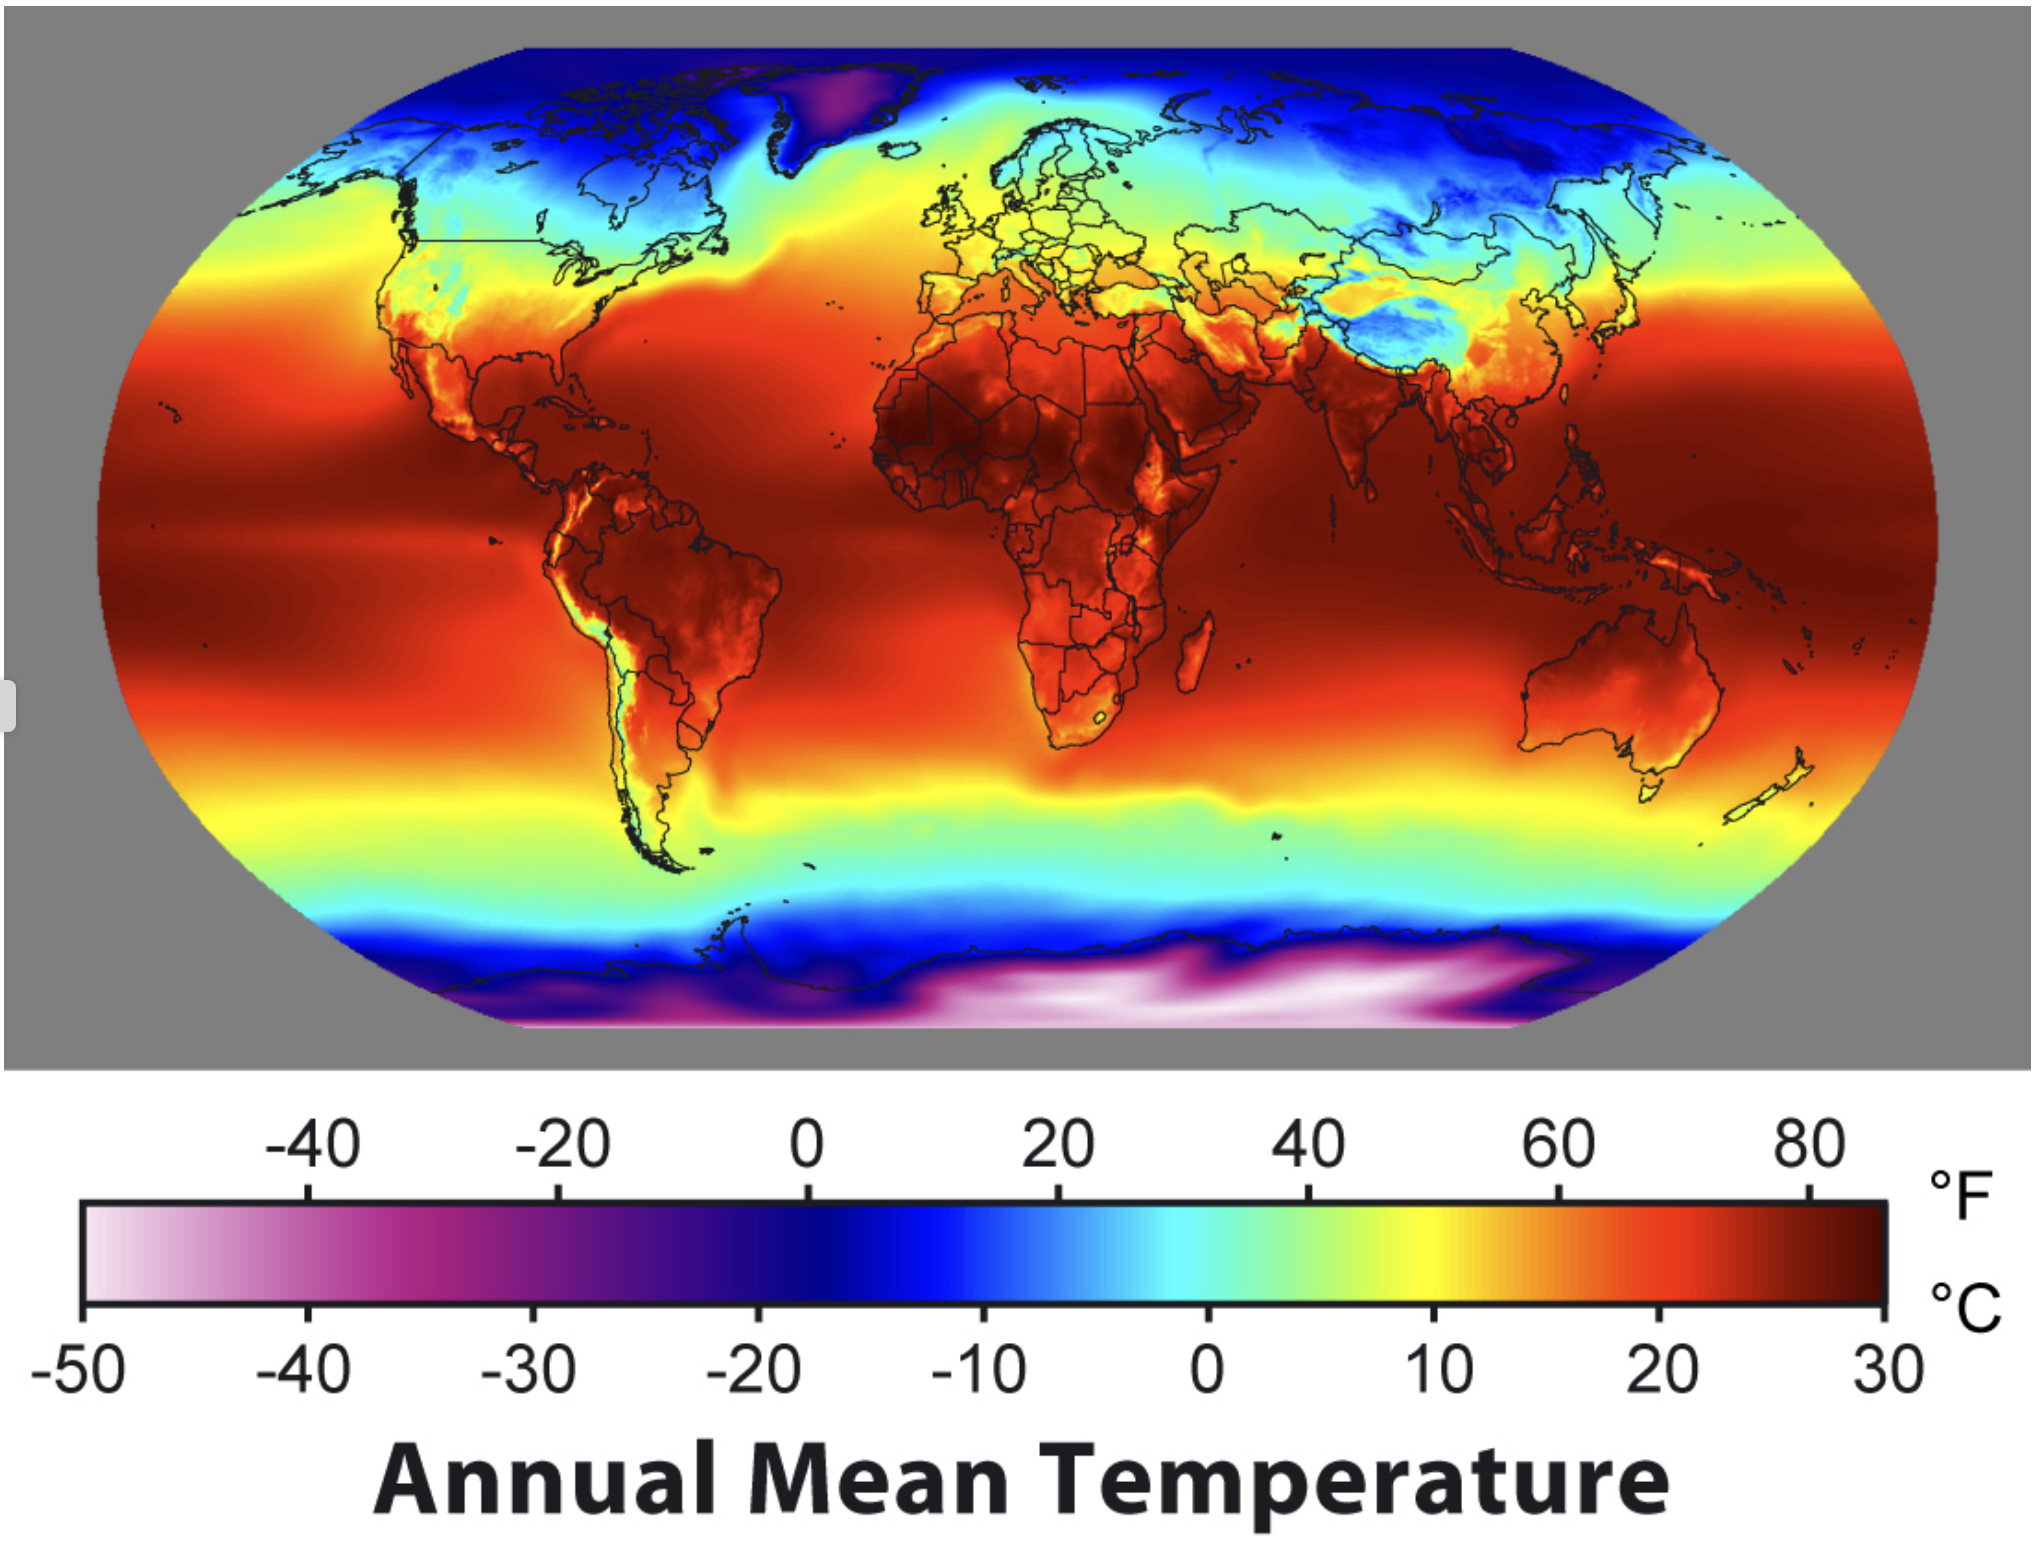
Figure 1
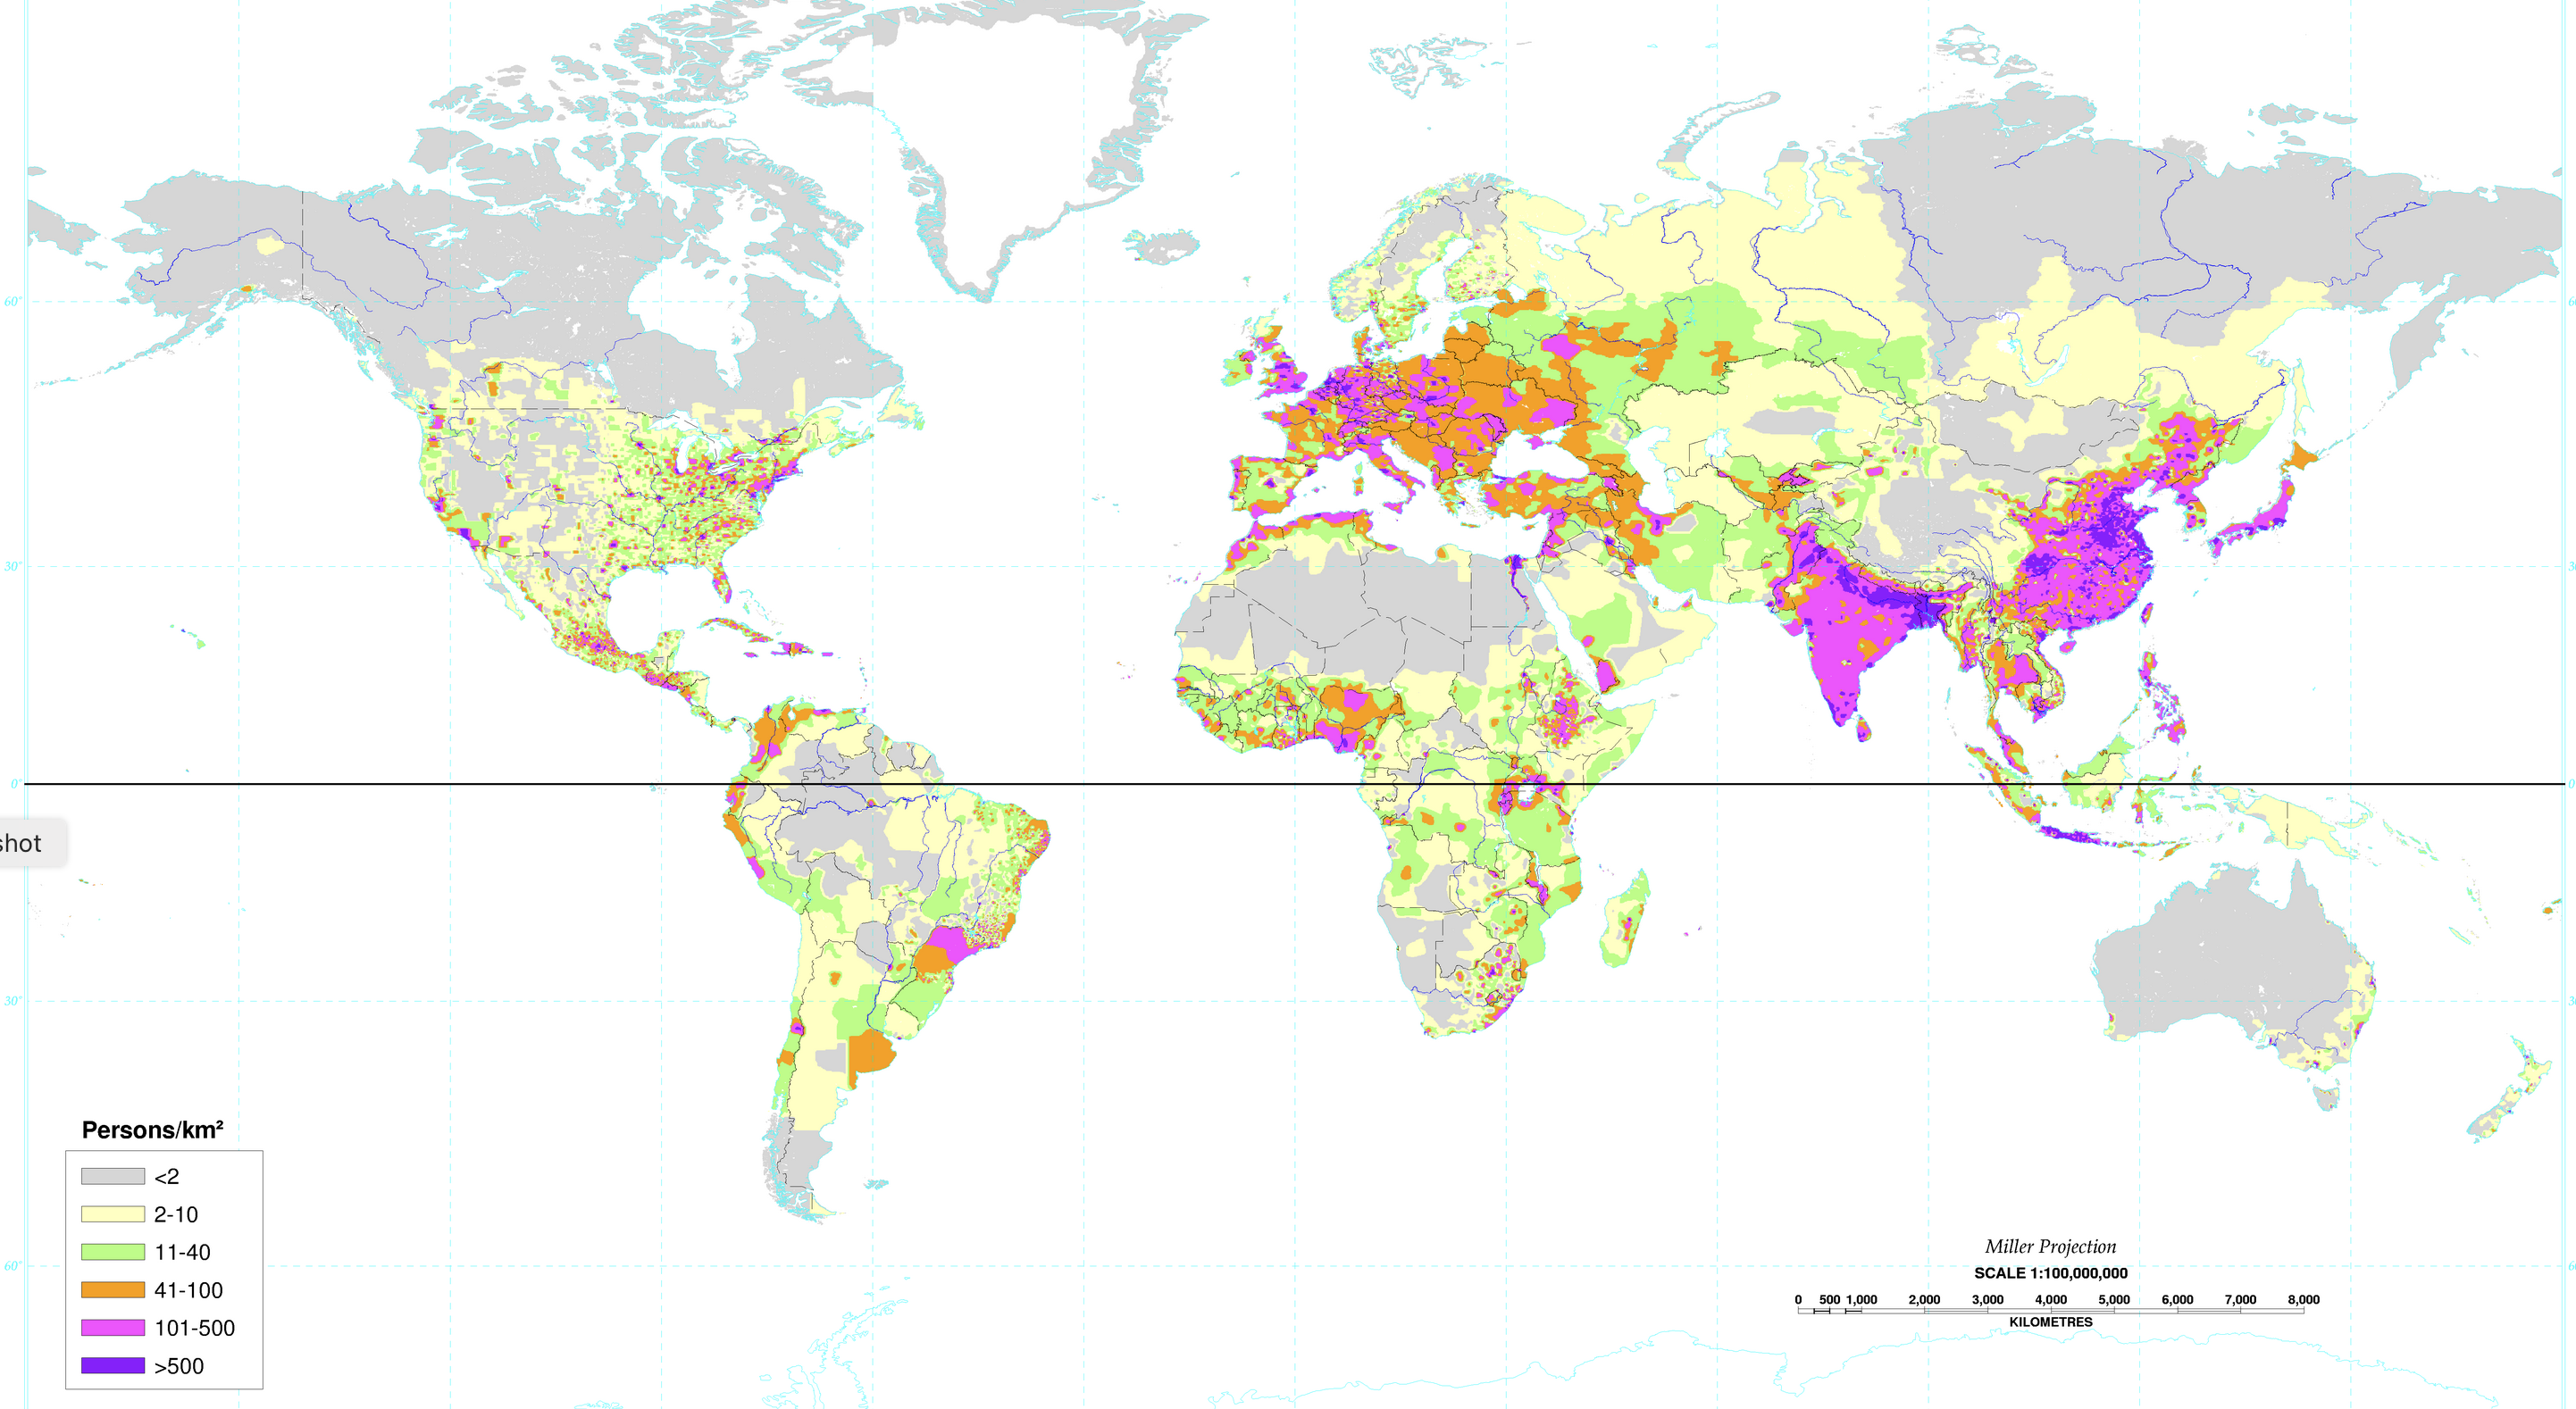
Figure 2
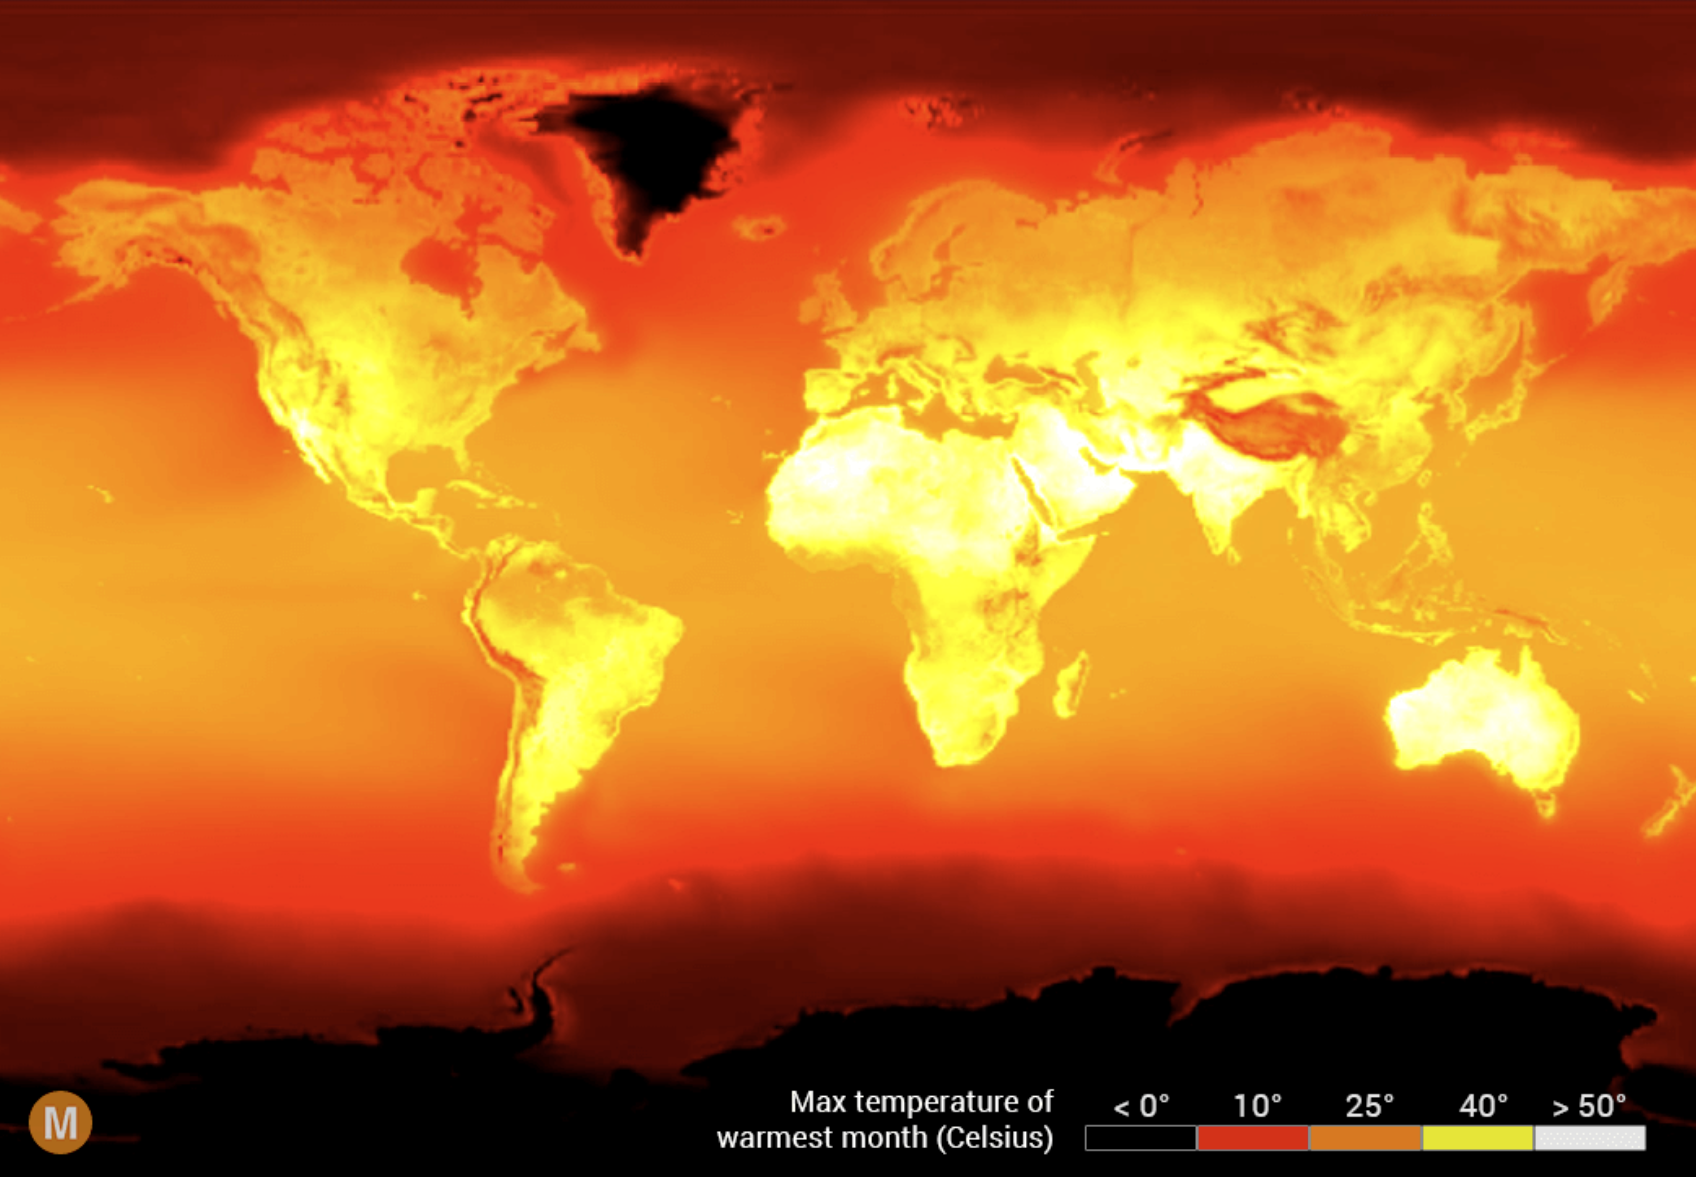
Figure
3
Arguably what habitability depends on is not average but maximum
temperature; if it gets unendurably hot during a summer day, the fact that
winter nights are cold is little compensation. Figure
3 is the equivalent of Figure 1 for maximum temperatures. The highest
temperature regions it shows include densely populated parts of India as well
as more sparsely populated parts of Africa and Arabia. Insofar as one can tell
from that map, there are no places large enough to show on the map where
maximum temperatures are too high for human habitation. It is possible that
some would be that hot after an additional three degrees of warning but the
combined evidence of Figures 2 and 3 suggests not, or at least not many, since
some of the hottest regions are densely populated.
I have been defining usable land as land humans can live on. It might make
more sense to define usable land as land suitable for growing crops. Is there
any significant amount of land that is too hot to grow crops?
So far as I can tell, there is not. Maps showing yield of various crops can
be found online; some
regions with high average and maximum temperatures show substantial yields. The
yields shown are averaged over countries but a map
of agriculture in India shows crops being grown across areas within India
of both high average and high maximum temperature.
My conclusion is that there is probably no substantial amount of land area
that will become either uninhabitable or unable to grow crops solely because of
temperature with global warming of 3°C.
This does not mean that there is no area that will become either
uninhabitable or unable to grow crops as a result of climate change, only that
there is no area where it will happen solely because of temperature. Looking at
Figure 2, one observes a wide region of northern Africa with almost nobody
living there — the Sahara. It is less hot than some populated regions, so
temperature is not the entire reason it is empty, but it can be, almost surely
is, part of the reason, so increased temperature might expand it.
On the other hand, the latest IPCC report suggests that climate change might
have the opposite effect:
Some climate model simulations suggest that under future
high-emissions scenarios, CO2 radiative forcing causes rapid
greening in the Sahel and Sahara regions via precipitation change (Claussen et
al., 2003; Drijfhout et al., 2015). For example, in the BNU-ESM RCP8.5
simulation, the change is abrupt with the percentage of bare soil dropping
from 45% to 15%, and percentage of tree cover rising from 50% to
75%, within 10 years (2050-2060) (Drijfhout et al., 2015). However, other
modelling results suggest that this may be a short-lived response to CO2
fertilization (Bathiany et al., 2014).
Human land use at present is limited by cold, not heat, as shown on Figure 2
above — the equator is populated, the polar regions are not. It follows that
global warming, by shifting temperature contours towards the poles, should
increase the amount of land warm enough for human habitation. Melting the
icecap over Antarctica would require considerably more than three degrees of
global warming and the southernmost land masses just north of it are already
inhabited, so significant land gains from warming will be in the northern
hemisphere.
It seems likely that habitability in cold regions depends more on minimal
than on average temperature. Figure 11.SM.1 of the sixth IPCC report shows
minimum temperature of areas such as North America and Northern Asia going up
by between 2 and 3.4 degrees per degree of global warming. Since warming is
greater in colder climates, I take 3 degrees per degree as a reasonable guess
for the increase in minimum temperature in the northern part of those zones.
It follows that three degrees of global warming will increase the minimum
temperature in the colder parts of those zones by about nine degrees. To
estimate how much land that will shift from not quite habitable to at least
barely habitable we need two numbers — the length over land of the contour
dividing barely habitable from not quite habitable and how far a nine degree
increase in temperature will shift it.
Figure
4 shows temperatures in January, which in the northern hemisphere should be
close to the minimum, with contours every five degrees — much more precise
information than Figures 1 and 3 provide. Combining the temperature information
on Figure 4 with the population density information on Figure 2, the border of
habitability appears to be at about -15°C. Nine degrees of warming will raise
the January temperature of land currently at -24° to -15°, shifting land
between those two contours from not quite habitable to at least barely
habitable. From Figure 4 I estimate the distance between the -15° and -25°
contours to average about 800 km, making the distance between -15° and -24°
about 720 km. I estimate the length over land of those contours to be about
15,000 km. Hence the area between them is about 10,800,000 km2.
While land at the northern edge of the zone is being warmed to barely
habitable, from a population density of less than two per square km to a
population density of more than two but less than ten, land a little farther
south is being warmed from barely habitable to more than barely habitable, and
the land south of that … . Combining those effects, 10.8 million square
km is a rough estimate of the increase in fully usable land.
The analysis so far has used population density as the measure of
habitability. As I suggested earlier, it might make more sense to use the
ability to grow crops. Crop production maps for Canada and Russia show
crops growing in about the same areas that appear habitable by population
density.
On the basis of these calculations I find, for the effect of climate change
by the end of the century under my assumptions:
Loss of usable land by flooding due to sea level rise: 21,436 km2
Loss of usable land due to the direct effect of warming: Uncertain but
probably small.
Increase of usable land due to the direct effect of warming: 10.8 million km2.
All of these numbers are very approximate but they imply an increase in the
amount of land warm enough to be usable by humans by a little more than the
area of the United States. They also imply that nearly five hundred times as
much land is gained through warming as is lost through sea level rise. They do
not, of course, tell us how much of the additional land will be suitable for
human use in other respects.
Florian Zabel, Birgitta Putzenlechner, and Wolfram Mauser, “Global Agricultural Land
Resources – A High Resolution Suitability Evaluation and Its Perspectives until
2100 under Climate Change Conditions,” PLOS One, vol. 9, Issue 9, September
014, found an increase in total area of land suitable for agriculture by
2071-2100 of 5.6 million km2 but a decrease in land highly suitable.
“Climate
change impacts on global agricultural land availability” by Xiao Zhang and
Ximing Cai 2011 Environ. Res. Lett. 6 014014 estimates the amount of
arable land taking account of a wide range of constraints including soil
quality and humidity. It reaches a less optimistic conclusion, finding
increases in some regions, decreases in others, with the net effect
ranging from -.8 million km2 to +1.2 million km2.
Ramankutty, N. et al 2002, “The
global distribution of cultivable lands: current patterns and sensitivity to
possible climate change,” Global Ecol. Biogeogr. 11 377–92, gets a
result closer to mine. The authors conclude “In the GCM-simulated climate of
2070–99, we estimate an increase in suitable cropland area of 6.6 million km2.”
Ramankutty took account of the reduction in water requirements for plants due
to CO2 fertilization, the other two did not.
Since I am estimating land warm enough for human use and the articles are
estimating land suitable for cultivation it is not surprising that their figure
is lower than mine. The Sahara, for example, is warm enough for human use —
there are densely populated regions that are warmer — but not currently
suitable for cultivation.
All three models are more sophisticated than mine since they include
constraints on agriculture other than temperature. One advantage of mine is
that it is simple enough so a lay reader can, with a little effort, check it,
convince himself that the results are at least approximately correct. To do the
same with either of the other three would require more expertise than anyone
not in the field is likely to have and, even for someone with the relevant
expertise, quite a lot of time and effort.
That is important for two reasons. The first is that the problem is
complicated enough so that different teams of professional authors can get very
different answers, as the articles demonstrate, hence the reader, provided only
with the answer, has no way of knowing which to believe. The second is that the
effects of climate change are a subject that many people feel strongly about.
In such an environment, the reader has good reason to put more weight on a
crude analysis that he can test for himself than on a more sophisticated
analysis that he cannot. I have tried to make my arguments on climate issues
here depend only on facts that an intelligent reader with access to the
internet can check for himself.
Trust but verify. If you cannot verify be reluctant to trust.
Overall, climate change could make it more difficult to grow
crops, raise animals, and catch fish in the same ways and same places as we
have done in the past. (EPA
Page)
Estimates of the effect of climate change are sometimes calculated on the
assumption that people affected by climate change make no attempt to adapt what
they are doing to take account of it. For the slow change projected that is
implausible but sometimes it is all your data can tell you.
Suppose, for example, you want to know how crop yields change with
temperature. You look at yields in a location where annual temperature averages
thirteen degrees centigrade and observe that in years when it happened to be a
little higher yield was a little less than average. It is tempting to use that
information to calculate by how much yield falls for each degree of warming.
That has the advantage, compared to the alternative of comparing yields in
different places, that you are holding everything but temperature constant —
the same farmers, the same soil, the same technology.
It also has the disadvantage that you are holding everything constant. If
temperature averages thirteen degrees farmers will plant crop varieties suited
to that temperature. By the time they know that this year happens to be warmer
than average the seed is already in the ground and many of the decisions for
the year have been made. If, on the other hand, temperature is rising at two or
three tenths of a degree per decade, farmers will have time to take account of
the changed circumstances in their decisions, shift crop varieties, irrigate
more or less, change what they are doing to adapt to the changed circumstances.
The result without adaptation ignores all that, hence overestimates the loss.
It might even find a loss where there is actually a gain.
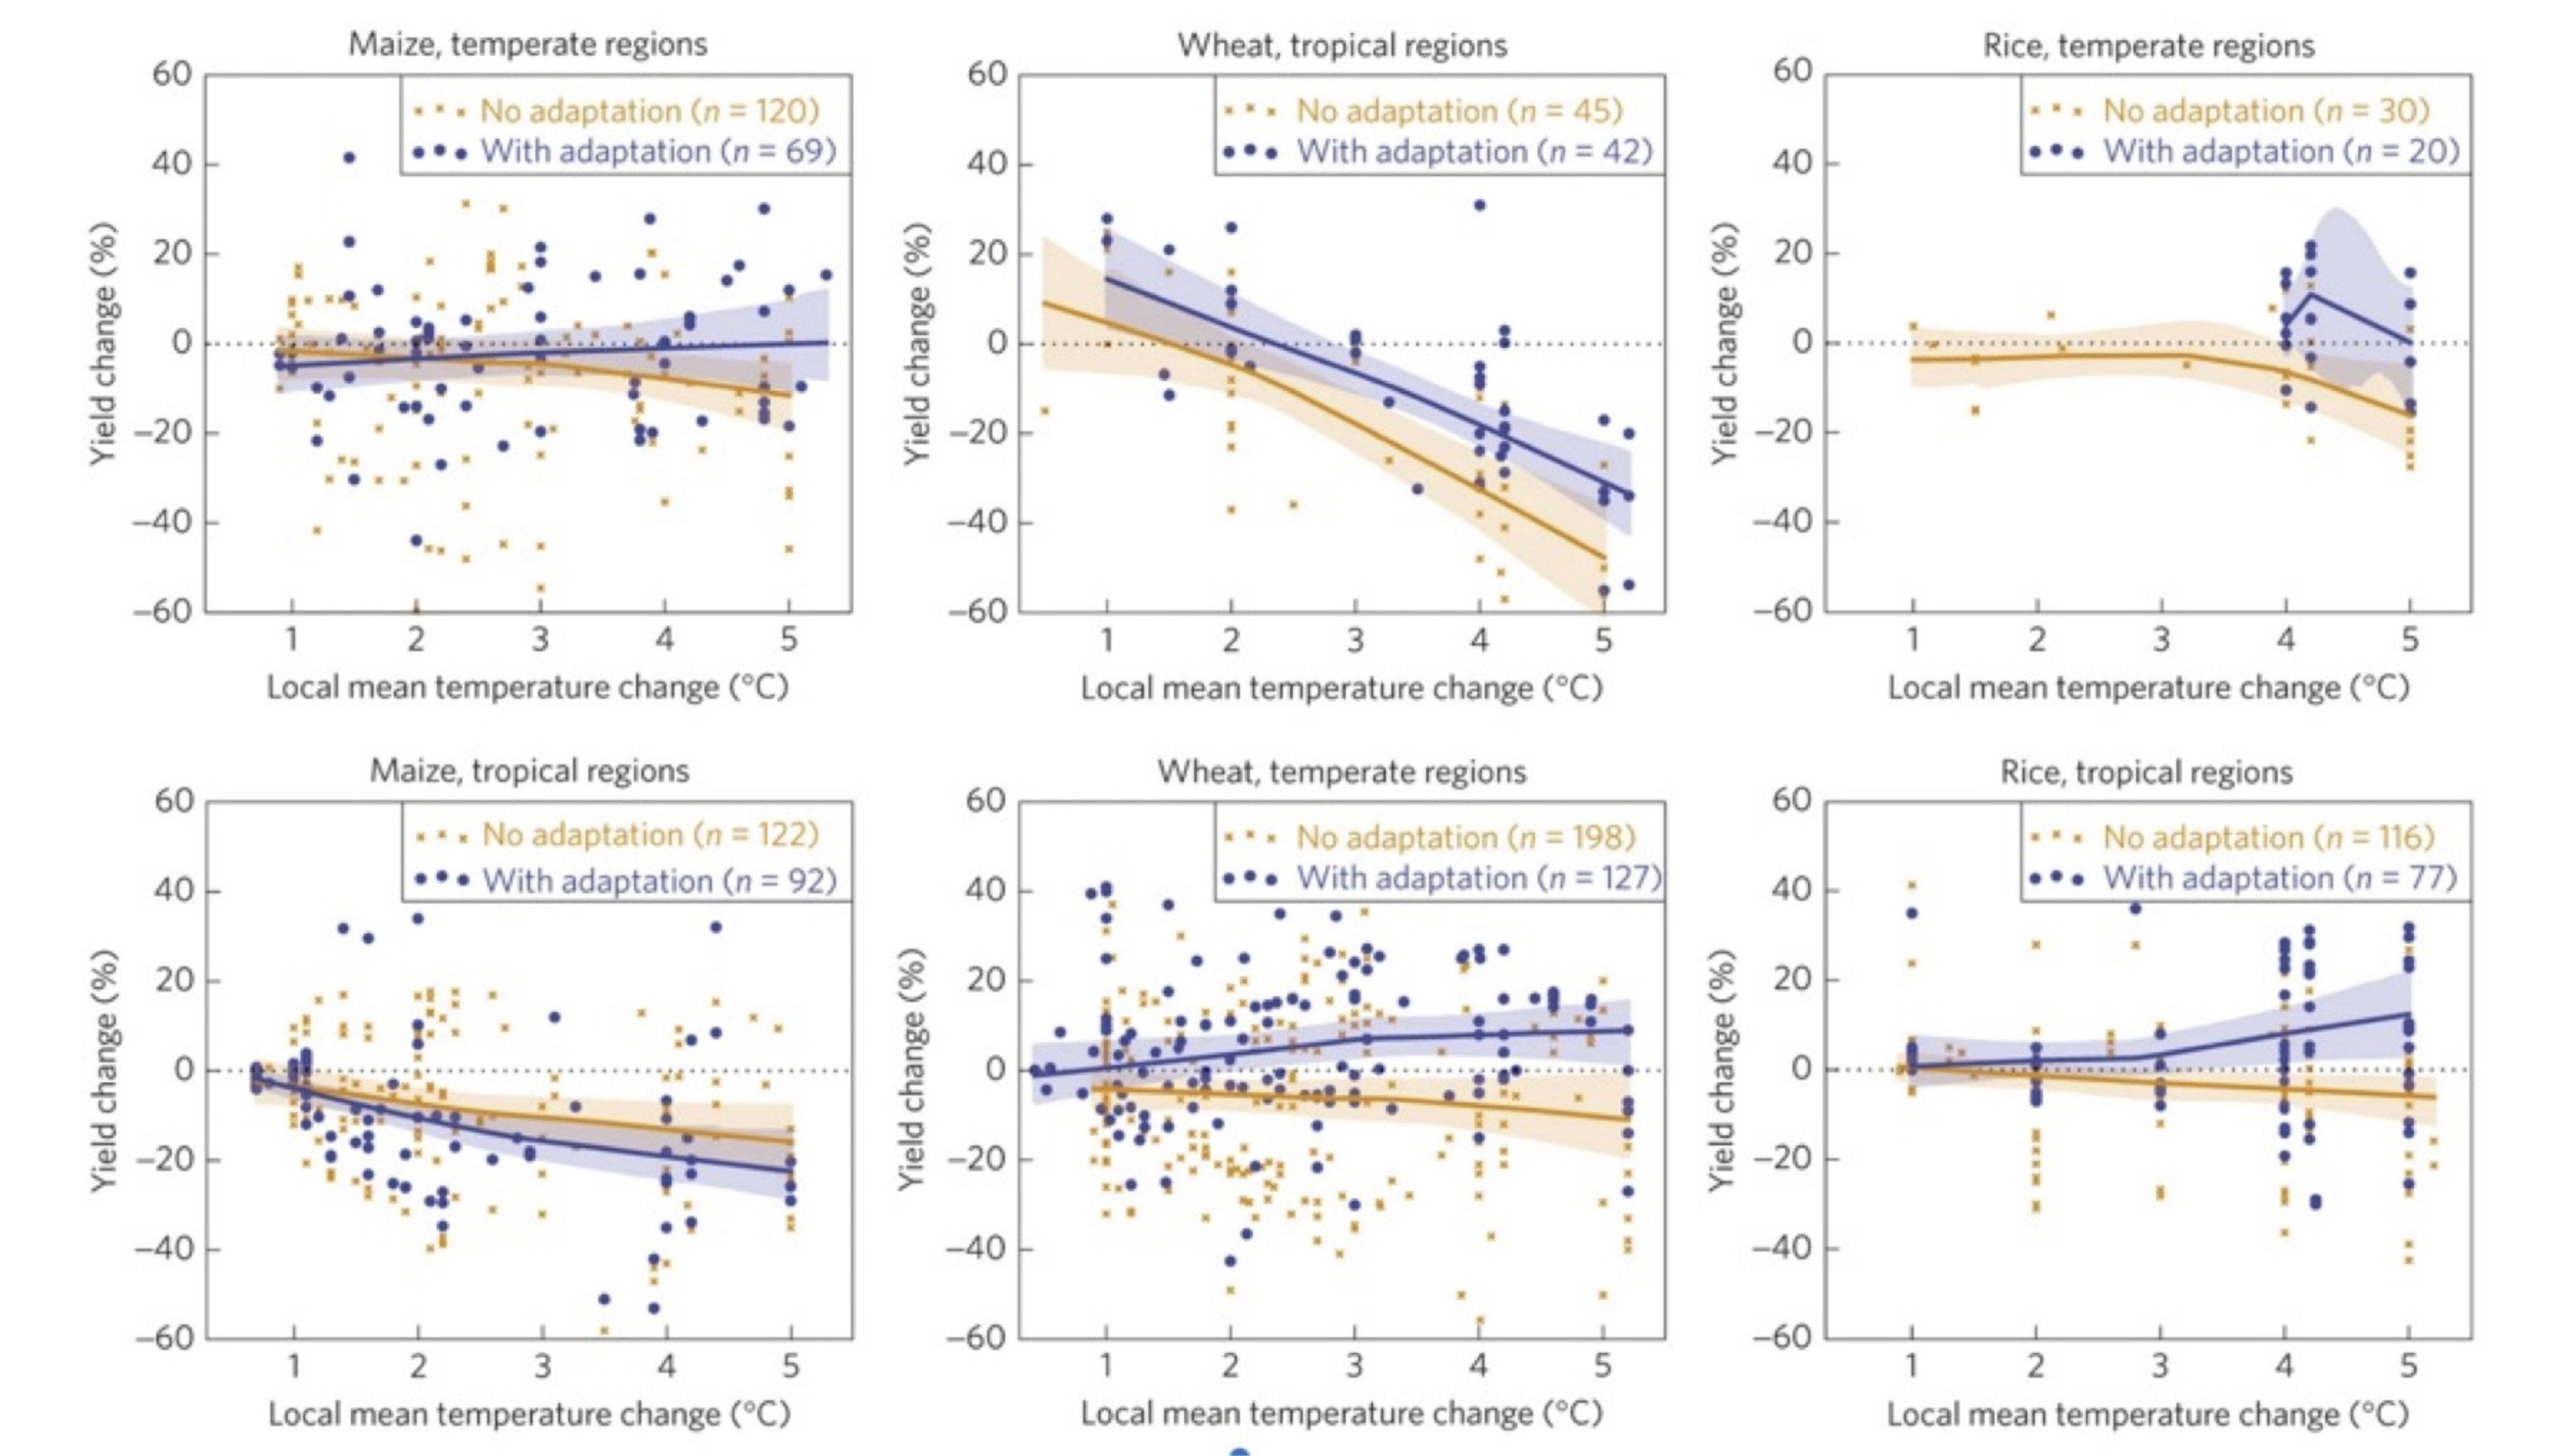 These graphs, from Challinor et. al. 2014,
show the effect of temperature on yield for wheat, rice and maize in both
temperate and tropical regions. Without adaptation yield falls with increased
temperature in all cases. With adaptation it rises with temperature for wheat
in temperate regions, where most wheat is grown, rice in tropical regions,
where most rice is grown, and maize in temperate regions, where about 70% of
maize is grown.
These graphs, from Challinor et. al. 2014,
show the effect of temperature on yield for wheat, rice and maize in both
temperate and tropical regions. Without adaptation yield falls with increased
temperature in all cases. With adaptation it rises with temperature for wheat
in temperate regions, where most wheat is grown, rice in tropical regions,
where most rice is grown, and maize in temperate regions, where about 70% of
maize is grown.
Crop yields depend, among other things, on temperature, with an optimal
average temperature for each crop — about 15°C for wheat, for example (Lobell 2012). If temperature
goes up by a degree, yield in an area that used to be 15° and is now 16° goes
down a little. That is one of the effects that goes into estimates of reduced
yield as a result of climate change.
But it shouldn’t, since the same warming that shifts 15° up to 16° also,
somewhere a little farther north in the northern hemisphere or south in the
southern, warms 14° to 15°, 13° to 14°, and so on. If wheat was being grown
between, say, 13° and 17°, the area of cultivation can shift towards the pole
by a distance that changes average temperature by one degree, roughly two
degrees of latitude, and continue to have a temperature range of 13°-17° and
the same temperature-related yield as before.
I see two possible objections to this argument. The first is that the land a
little closer to the pole may be less well suited to growing wheat in respects
other than temperature, have worse soil, too much or too little water. That is
possible but why should we expect it? Is there any reason why land that happens
to have the ideal temperature for growing wheat is also more likely than other
land to have the ideal soil or the ideal amount of rain? If not, then on
average the shift is to land about as well suited in other ways and now ideally
suited in temperature.
The second objection is that shifting the area of cultivation is costly.
Farms have irrigation systems and farm machinery suitable to growing what they
are currently growing, are owned or managed by people experienced in doing so.
You cannot just pick all that up and shift it a hundred miles further north.
How serious an issue this is depends on how fast the shift happens. Looking
at maps showing average temperature, it seems to go down as you move towards
the poles by about a degree every hundred miles, with a good deal of variation.
At currently projected rates of climate change, global temperature should be
going up by about a degree every thirty years. So shifting the area of
cultivation to keep the temperature at which wheat is being grown constant
should require moving it by about three miles a year, with farms at the warm
edge of the zone shifting to crops with a higher optimal temperature such as
maize (18°) while farms at the cold edge are shifting from barley or vegetables
to wheat.
If that argument is correct, reduced yield with warming should not be
included in the predictable effects of climate change on agriculture. That is
one example of the problem of calculating effects of climate change on the
implicit assumption that people make no attempt to take account of it in their
decisions.
If there is substantial climate change we will not continue to “raise
animals, and catch fish” — or grow wheat — “in the same ways and same places as
we have done in the past." As I commented on the same problem decades ago
in response to the book Limits to Growth, it is like trying to
extrapolate the path of an automobile on the assumption that the driver has his
eyes closed.
Most plants use one of two mechanisms for photosynthesis, C3 or C4.
Doubling the concentration of CO2, an input to photosynthesis,
increases the yield of C3 plants, typically by more than twenty percent,
with the exact increase varying with species, variety, and experiment. Some
experimenters report no increase in yield of C4 plants with increasing
concentration of CO2, others find some but substantially less than
with C3 plants. Most crop plants are C3; the important exceptions are maize,
sugarcane and sorghum.
Because increasing CO2 concentration reduces the amount of air
that a plant must pass through its leaves in order to get an adequate amount of
carbon, it reduces loss of water. That effect applies to both C3 and C4 plants.
Experiments on growing crops in water stressed environments show substantial
increases in yield with increased CO2 concentration.
CO2 fertilization is a well-established effect measured in both
enclosed and free air experiments and routinely used to increase yield in
greenhouses. Unlike
other predicted climate effects on agriculture it depends on only the first
step in the causal chain, the increase in CO2 concentration. It
implies a large increase in crop yield — a fact frequently ignored in
discussion of the effects of climate change.
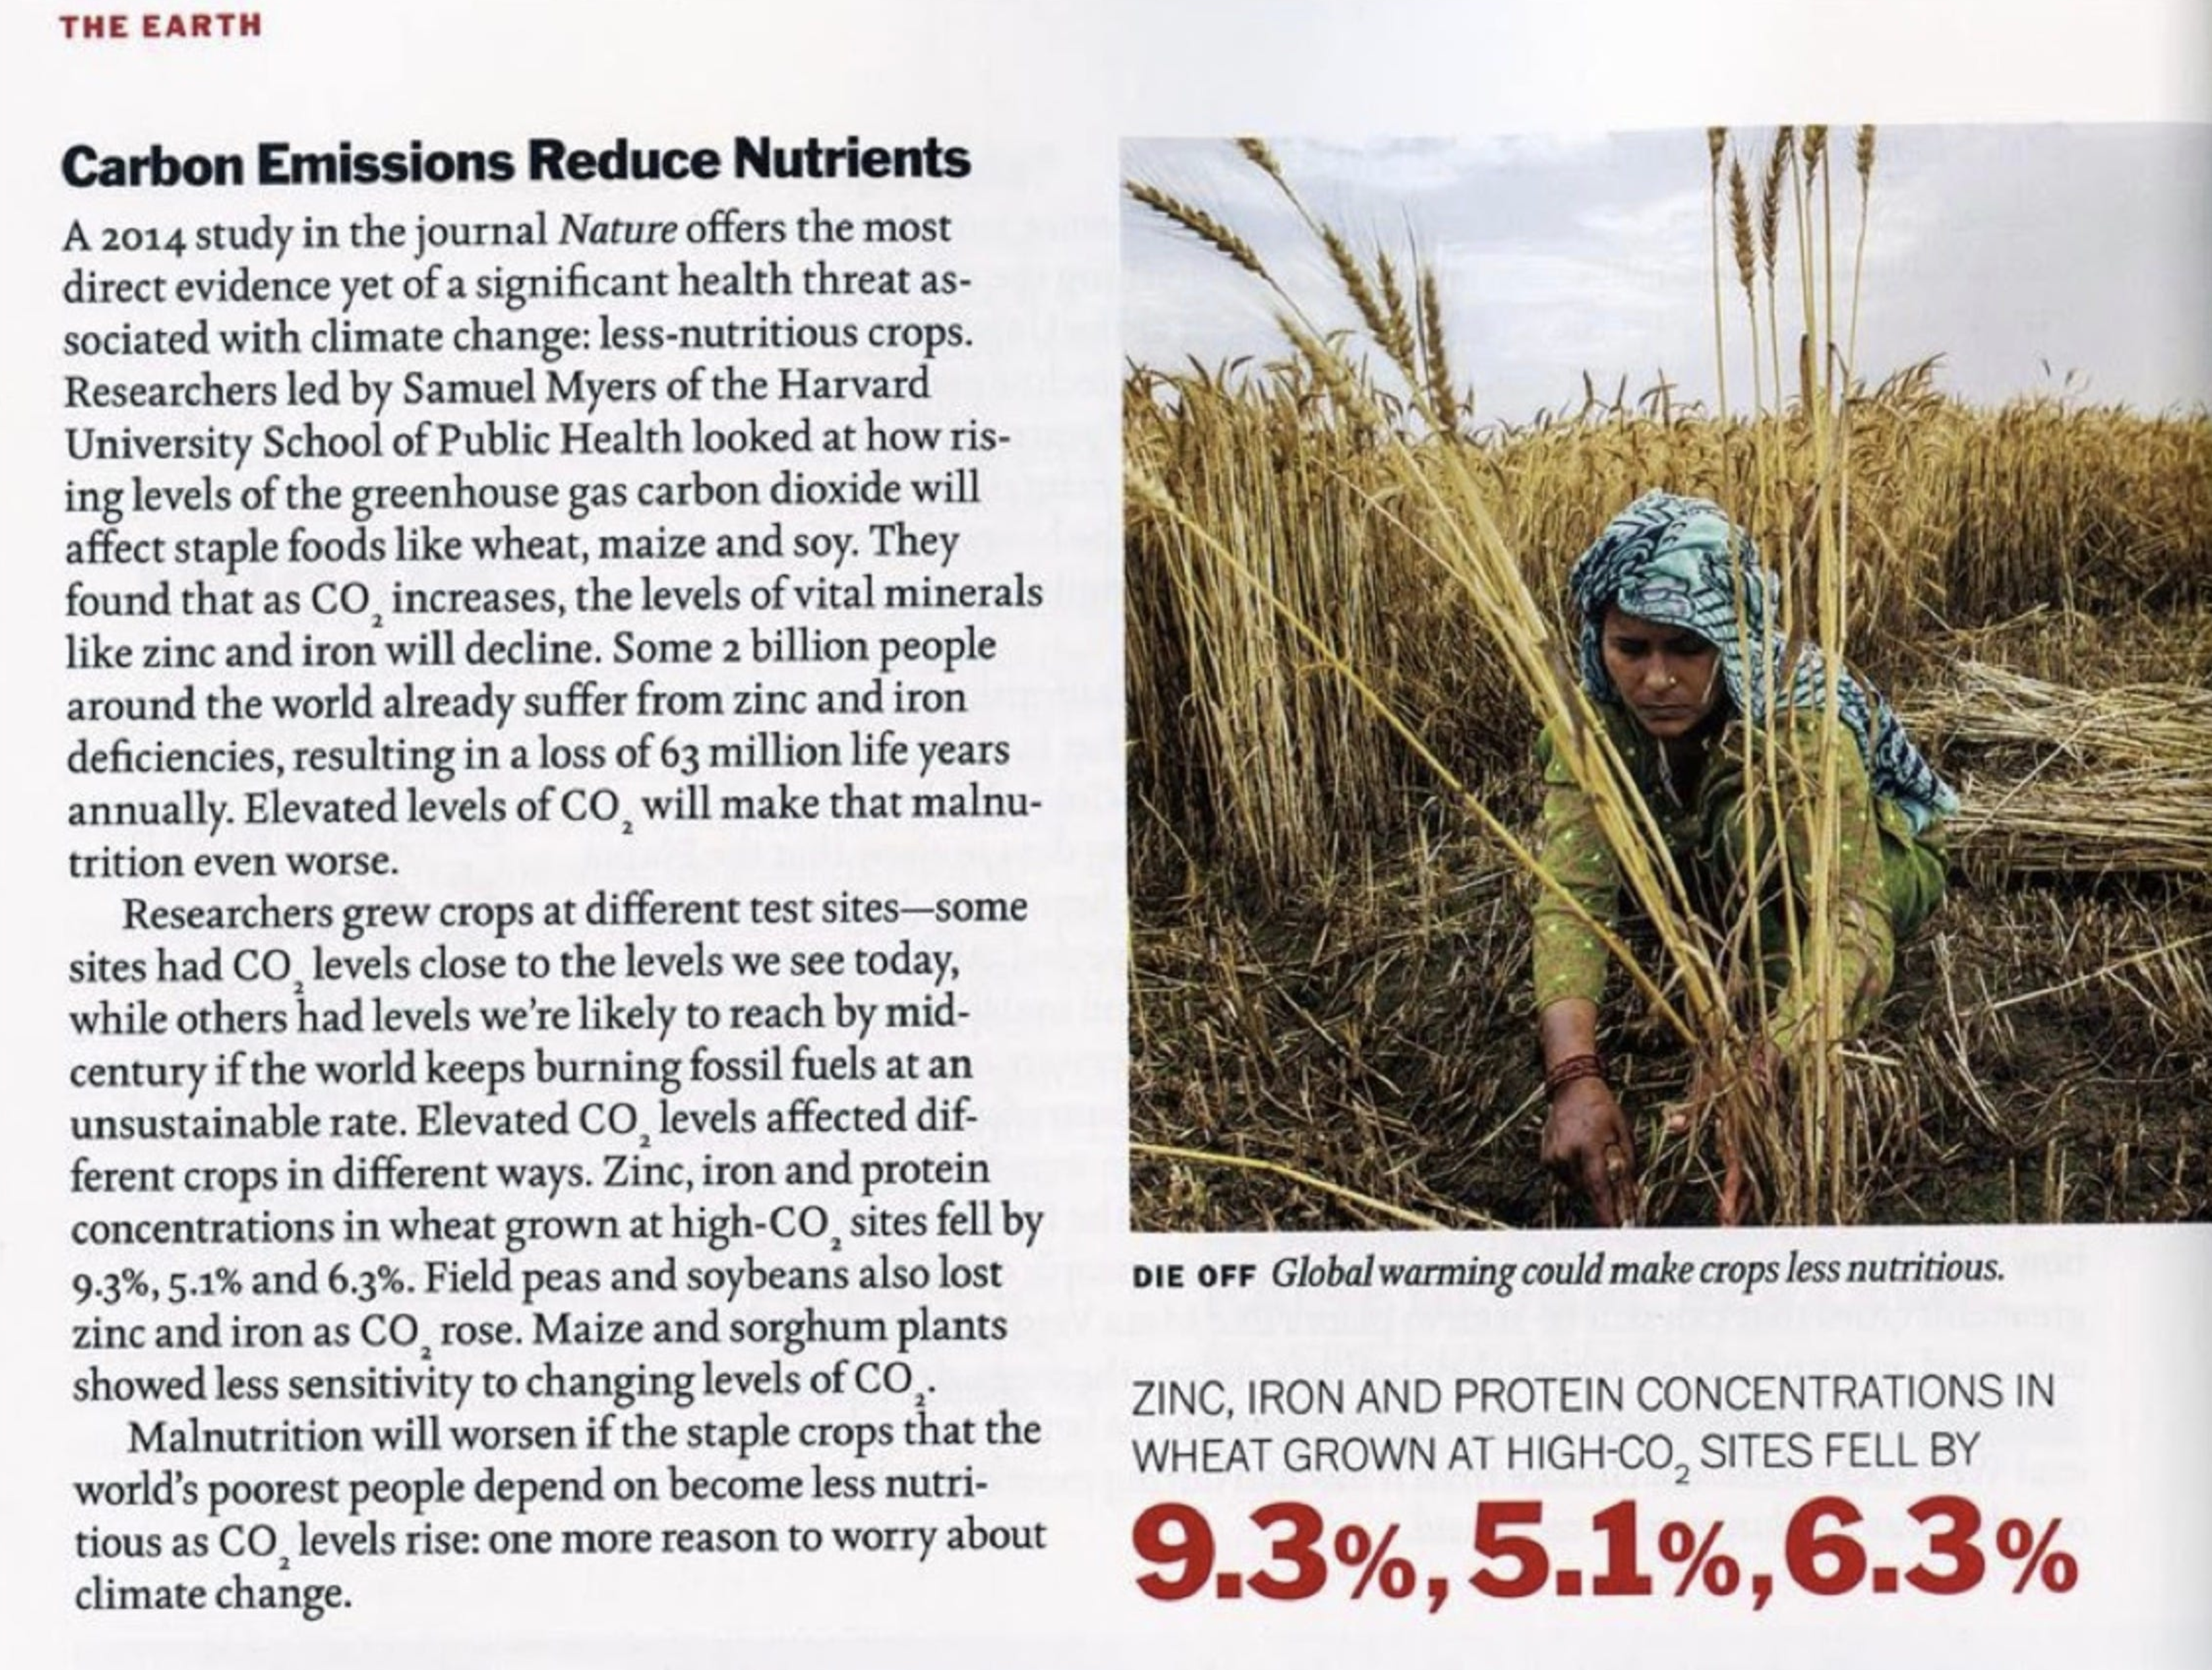
The news story shown above is based on an article in Nature, Increasing
CO2 threatens human nutrition, which found that increasing CO2
concentration from the ambient level, about 400 ppm when the research was
done, to 546–586 ppm, reduced the concentration of zinc by 9.3% and of iron by
5.1% in wheat, with similar results for rice, field peas, soybeans and maize
but not sorghum. For all except soybeans and sorghum they also found a
reduction in the concentration of protein.
Concentration is not defined in the article but probably means the ratio of
nutrient to calories.
The increase in yield due to the increased concentration is not reported in the
article but can be estimated from other experiments that used similar CO2
increases. If the concentration of zinc declines by 9.3% and of iron by 5.1%
while the amount of wheat produced per acre increases by 17%, as suggested by
one source,
the amount of zinc produced per acre increases by about 8%, of iron by about
12%. For rice as well but not for maize, nutrient concentration falls but
nutrient yield rises.
That raises a question that the authors of the article do not consider: Is
the constraint on nutrition how much food people want to eat or how much food
is available, the size of the human stomach or the productivity of the fields?
If people are sufficiently poor or food sufficiently expensive, we would expect
an increase in yield to result in an increase in how much they eat. If they are
sufficiently rich or food sufficiently cheap, we would expect it to produce a
decrease in how much they plant. That suggests that nutrient concentration
should be more relevant in richer countries, nutrient yield in poorer.
Iron and zinc deficiencies are a problem primarily in poor countries.
The global distribution of the disease burden of IDA [iron
deficiency anemia] is heavily concentrated in Africa and WHO region Southeast
Asia-D (table 1). These regions bear 71% of the global mortality burden and 65%
of the DALYs lost. By contrast, the DALYs lost to IDA in North America and Cuba
amount to 1.4% of the global total.
The percentage of the national population at risk for low
zinc intake ranges from 1%–13% in countries of Europe and North America to
68%–95% in South and Southeast Asia, Africa, and the Eastern Mediterranean
regions, …
The source of the second quote also gives calorie intake per capita by
region; it ranges from 3546 in the U.S. and Canada down to 2351 in South Asia
and 2203 in Sub-Saharan Africa. The less people eat, the more likely it is that
amount of food available is an important constraint. Increasing CO2 makes
nutrition worse for some people, better for others. It would take more
information than I have, probably more than exists, to know which group is
larger but it is pretty clear that the second group is poorer.
All of this is for the world as it now is. Many who regard climate change as
a serious threat to human welfare expect one of its effects to be a serious
worsening of the food supply. If so, more people in the future will find their
nutrition constrained by the availability of food hence will be benefited, not
harmed, by changes that decrease nutrient concentration but increase nutrient
yield.
That brings us back to the subject of adaptation. If CO2
fertilization reduces the amount of iron and zinc people get, they can adapt by
consuming fortified foods, as many in the developed world already do, or taking
supplements.
The article reports figures not only for crop species but for crop
varieties. All the varieties of wheat tested had lower concentrations of zinc
and iron with CO2 fertilization although the amount of the reduction
varied substantially, but another source reported an increase in iron
concentration in one variety.
Some varieties of rice increase concentration with CO2
fertilization for zinc and one for iron. As the article says:
Such differences between cultivars suggest a basis for breeding
rice cultivars whose micronutrient levels are less vulnerable to increasing [CO2].
Similar effects may occur in other crops, given that the statistical power of
many of our other inter- cultivar tests was limited by sample size.
The article does not discuss differences in yield among different varieties
but other sources do. As CO2 concentration increases farmers can be
expected to adjust their choice of varieties, shifting towards those with
higher yields under the new conditions. If nutrient concentration turns out to
be an issue that consumers care about they can be expected to take that into
account as well. It follows that the results of articles like this should be
taken as a lower bound on future nutrient and yield, again because they ignore
adaptation.
I have been following the article in using “nutrition” to refer to the
specific nutrients it discusses. Increasing crop yield improves the most
fundamental form of nutrition, calories, for everyone. That fact, surely the
most important consequence of CO2 fertilization, is mentioned in
neither the news story nor the article. Judging by a quick look at mineral
supplements online, a year’s RDA of either zinc or iron costs about ten
dollars. A year’s worth of calories costs considerably more than that.
Antonio
Gasparini et. al. 2015 is an article in Lancet estimating global
mortality from heat and cold, using an elaborate statistical process
applied to an enormous collection of data, more than 74 million deaths across
384 locations in thirteen countries. It found mortality from cold, from
temperatures in each place below that at which mortality was minimized, to be
about seventeen times as large as mortality from heat, similarly defined. It
also found that mortality from both heat and cold was not mainly due to extreme
temperatures, heat waves and cold waves, but to less extreme temperatures above
or below the optimum.
More temperature-attributable deaths were caused by cold
(7.29%, 7.02–7.49) than by heat (0.42%, 0.39–0.44). Extreme cold and hot
temperatures were responsible for 0.86% (0.84–0.87) of total mortality.
Antonio
Gasparini et. al. 2017 is an article that estimates the mortality effect
from warming due to climate change over the rest of this century, combining the
IPCC projections of temperature change by country under four different
emissions scenarios (RCP2.6, RCP4.5, RCP6.0, and RCP8.5) with the earlier
article’s approach to measuring the effect of temperature on mortality.
Results indicate, on average, a net increase in temperature-related excess
mortality under high-emission scenarios, although with important geographical
differences. In temperate areas such as northern Europe, east Asia, and
Australia, the less intense warming and large decrease in cold-related excess
would induce a null or marginally negative net effect, with the net change in
2090–99 compared with 2010–19 ranging from −1.2% (empirical 95% CI −3.6 to 1.4)
in Australia to −0.1% (−2.1 to 1.6) in east Asia under the highest emission
scenario, although the decreasing trends would reverse during the course of the
century. Conversely, warmer regions, such as the central and southern parts of
America or Europe, and especially southeast Asia, would experience a sharp
surge in heat-related impacts and extremely large net increases, with the net
change at the end of the century ranging from 3.0% (−3.0 to 9.3) in Central
America to 12.7% (−4.7 to 28.1) in southeast Asia under the highest emission
scenario.
The conclusion appears surprising; warming due to climate change should
reduce mortality from cold as well as increasing that from heat and total
mortality from cold is, according to the earlier article, much larger than from
heat. Further, greenhouse warming tends to be greater in cold times and places
than in warm, which should bias the effect in favor of a reduction in
mortality.
Figure 1 from the earlier article suggests a possible explanation; mortality
rises faster for temperatures above MMT (Minimum Mortality Temperature) than it
falls for temperatures below, especially for temperatures several degrees
above. While that is a possible explanation I still find the result surprising.
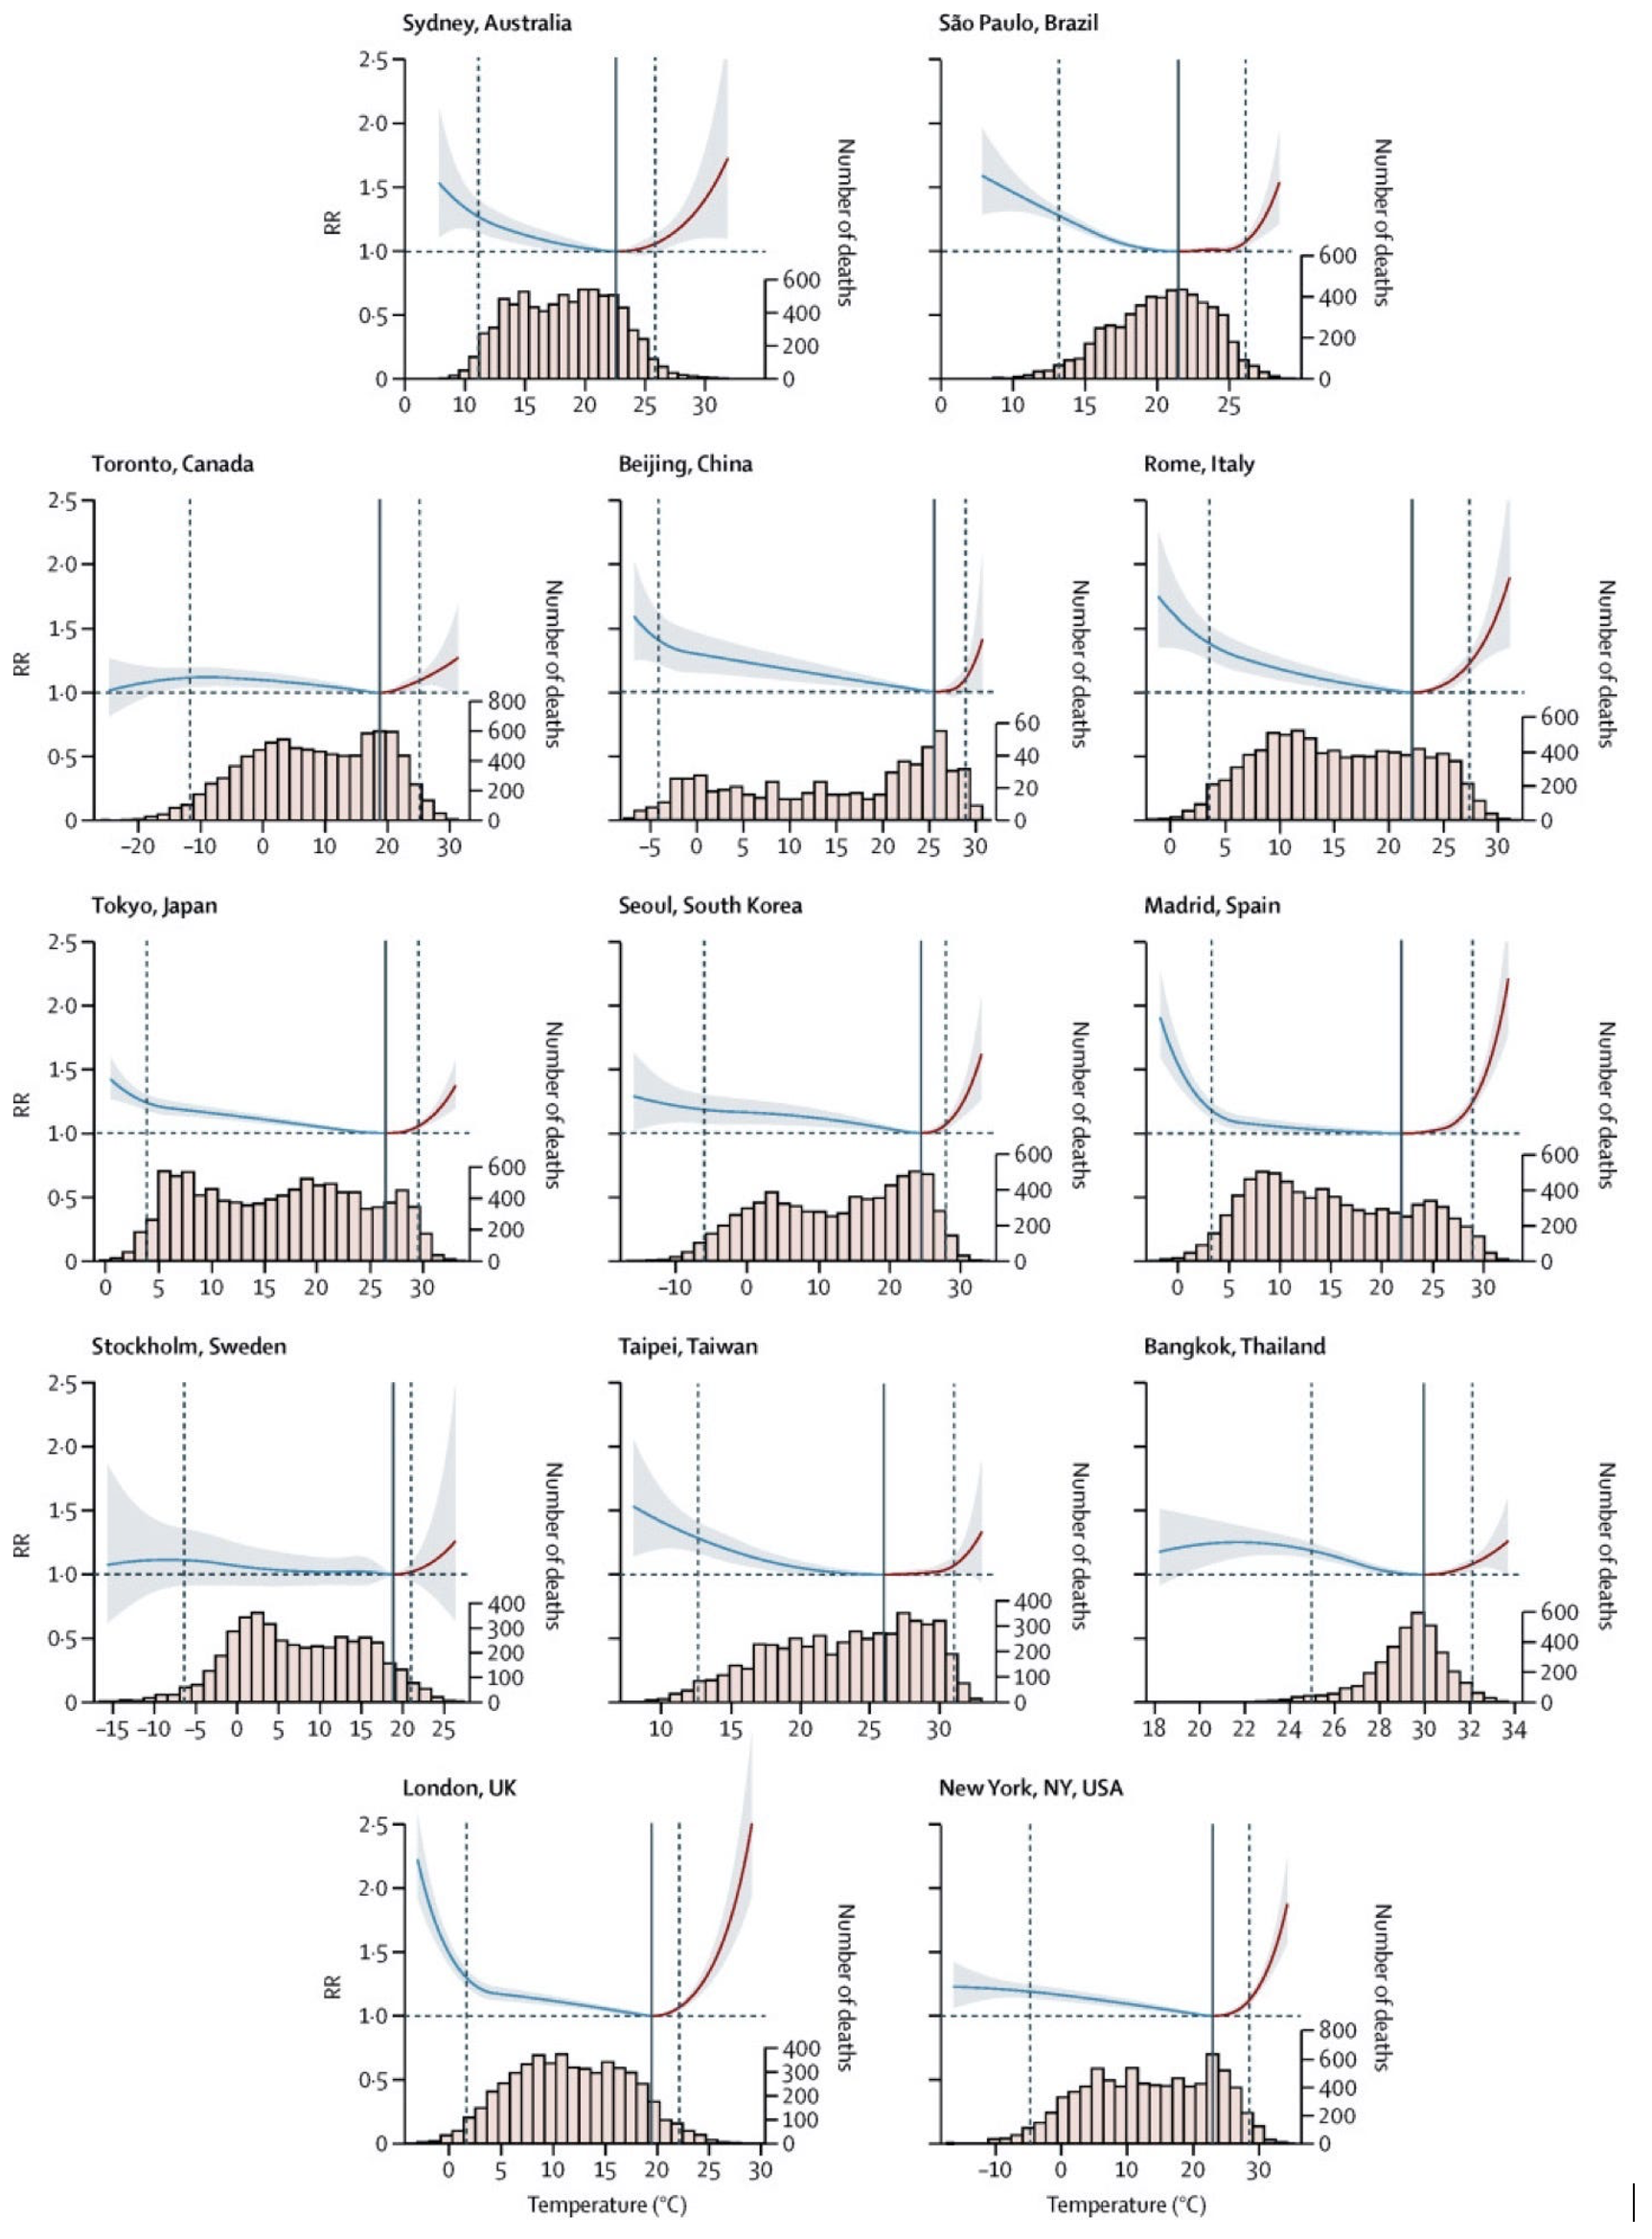 Figure 7-1: Overall cumulative
exposure–response associations in 13 cities
Figure 7-1: Overall cumulative
exposure–response associations in 13 cities
We projected excess mortality for cold and heat and their net
change in 1990–2099 under each scenario of climate change, assuming no
adaptation or population changes. (Gasparini et. al. 2017)
The assumption of no adaptation implies that the relation between
temperature and mortality will be the same after most of a century of warming
as it was initially. That cannot be correct. A Chicago winter in San Jose would
kill a lot more people relative to the population than it does in Chicago,
since people in San Jose have lighter clothing, less well insulated and heated
housing than people in Chicago. A Tucson summer in San Jose would kill more
people, relative to the population, than it does in Tucson, for similar
reasons. The article’s calculation simply assumes away everything that
individuals do to adjust their lives to their environment.
It is possible to use the article’s results to take account of adaptation,
although imperfectly. Looking at the graphs in Figure 1, mortality in each city
is more nearly a function of the deviation of temperature, positive or
negative, from that city’s Minimum Mortality Temperature than it is of the
absolute temperature. If we assume that mortality in each city is a function of
the deviation of temperature from its optimum it follows that if climate change
raises the average temperature of a city by three degrees and MMT for that city
by one degree the effect on mortality will be the same as if it raised the
average by two degrees with no effect on MMT.
To estimate the effect of climate change on MMT I used the observed relation
between average temperature and MMT across cities, assuming that it will be the
same across time as across space. Figure 2 shows the relation;
as one would expect, MMT increases with average temperature. A least squares
fit to the data finds a slope of .41; on average, MMT goes up .41° for every
degree increase in average temperature. It follows that we can estimate the
effect on mortality with adaptation by reducing the temperature increases used
in the article accordingly, replacing a temperature increase of ∆T due to
climate change with an increase of .59∆T.
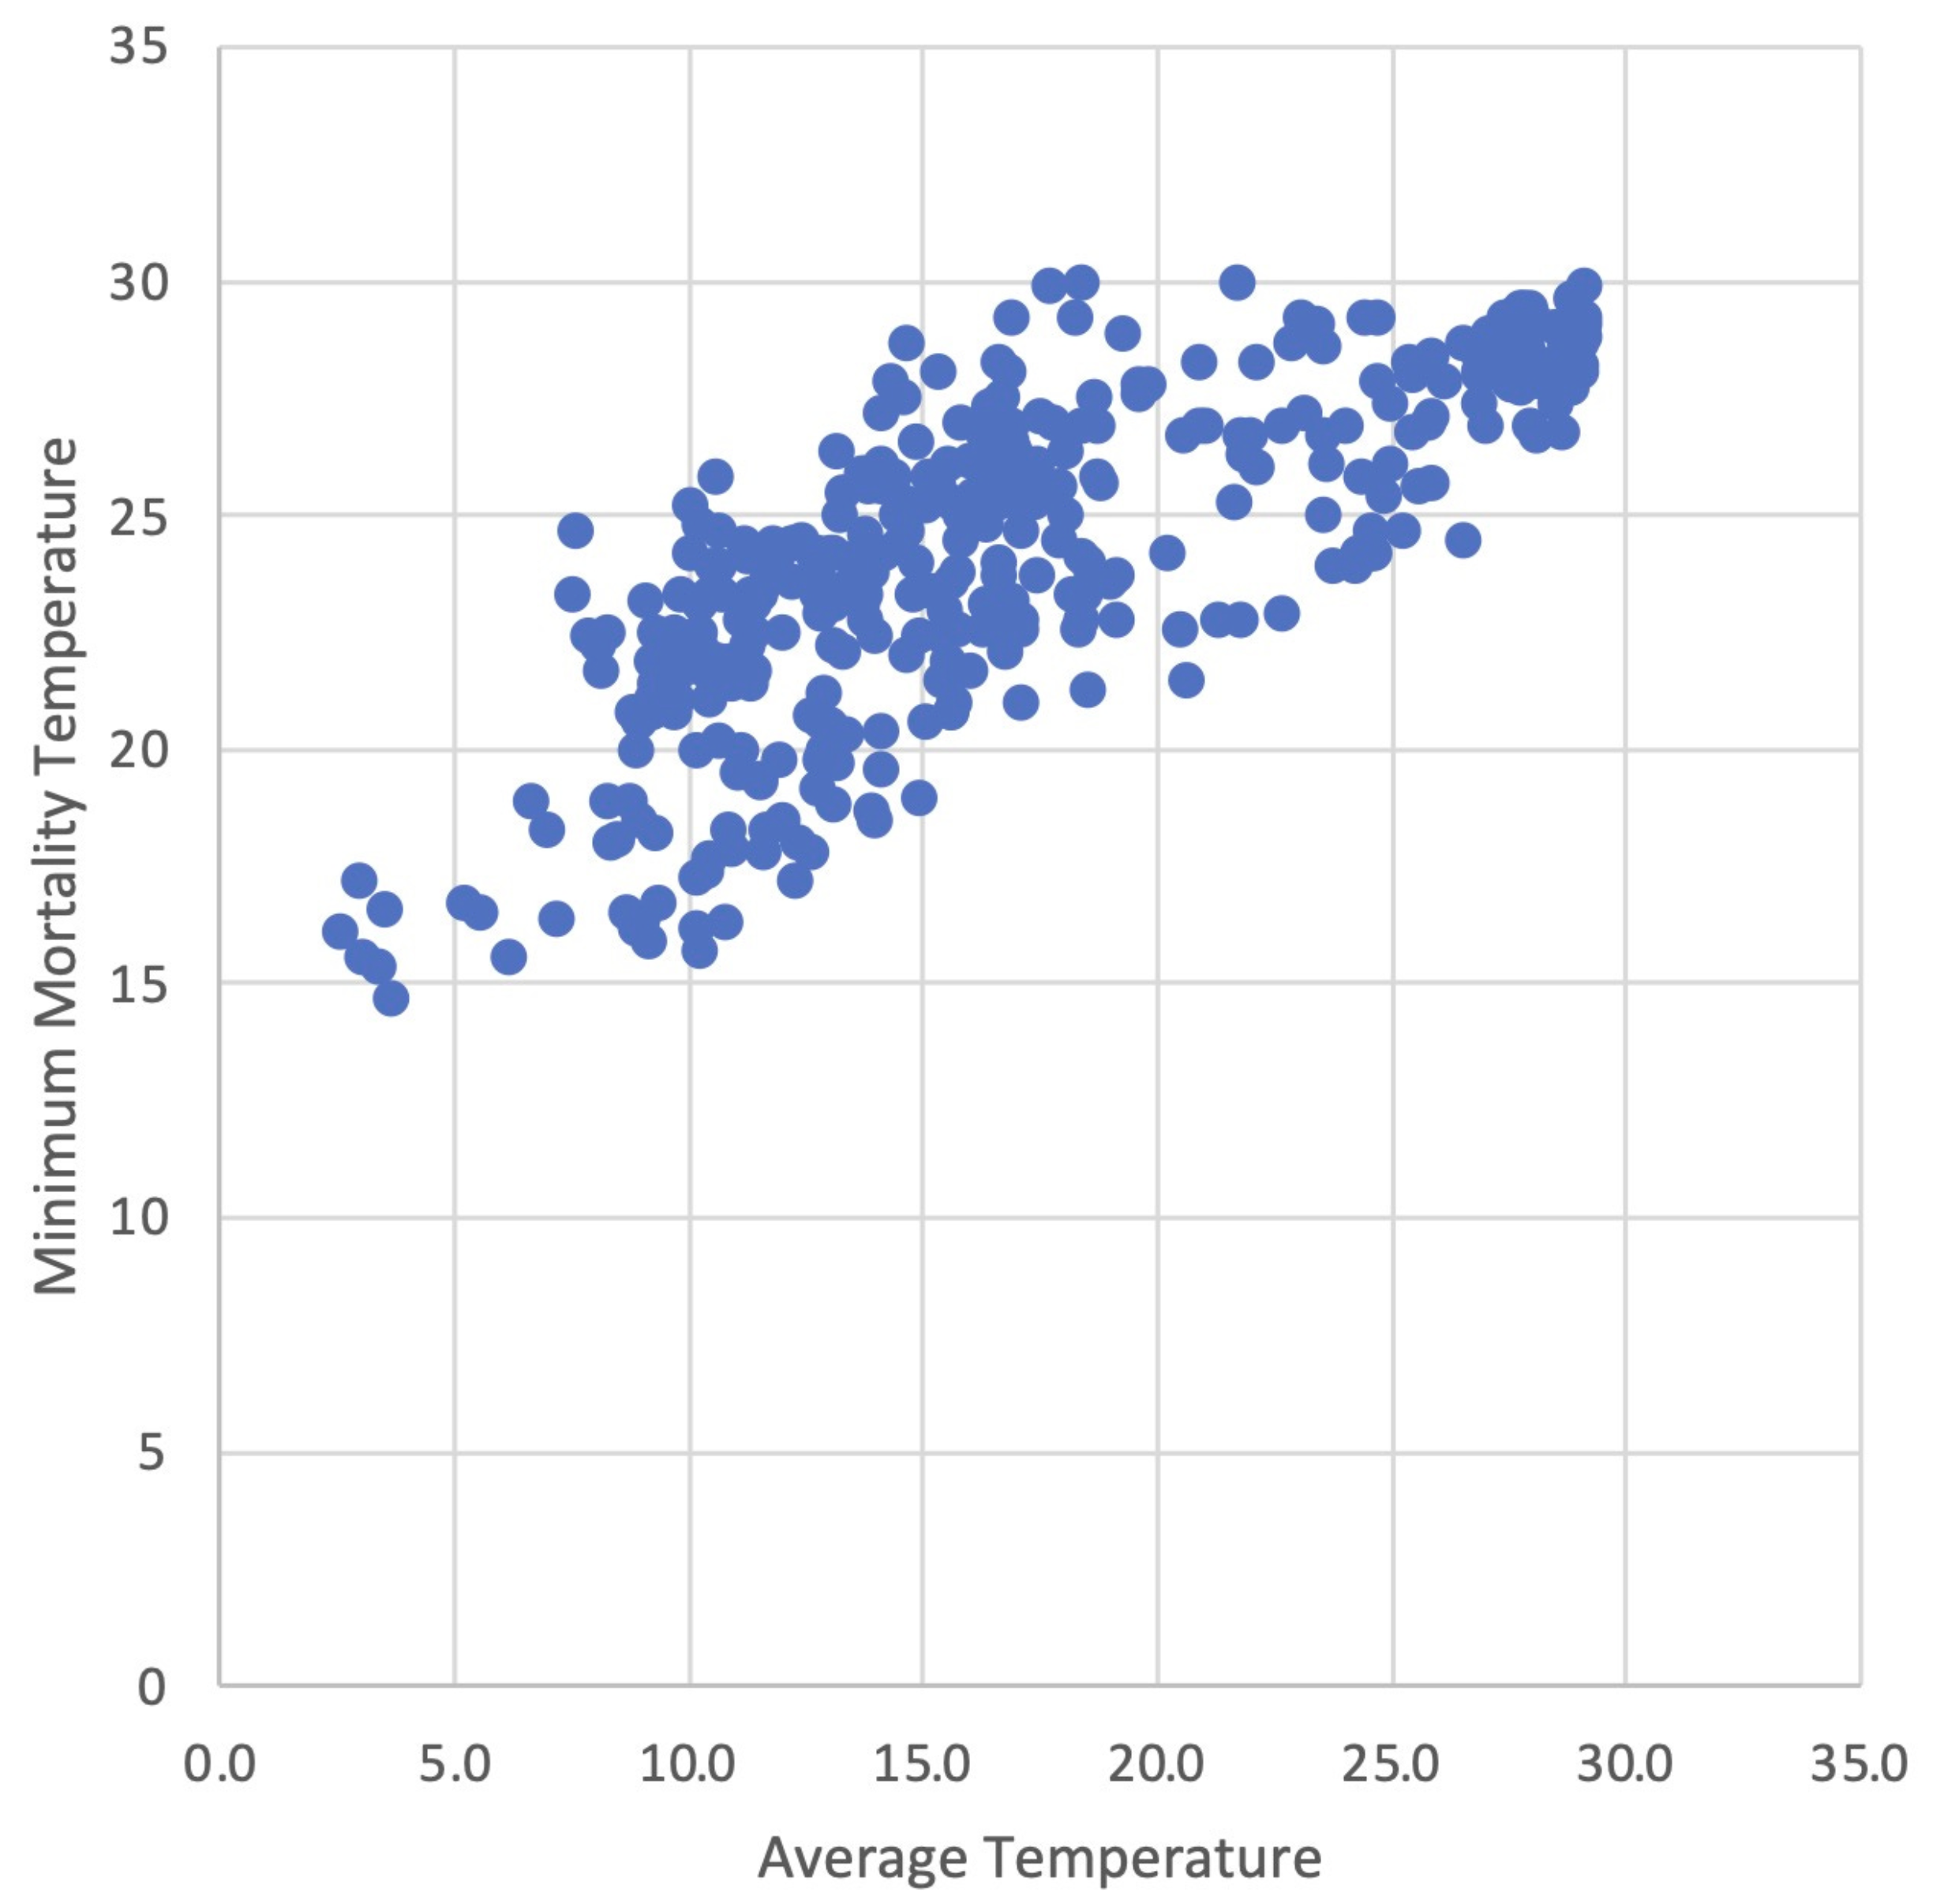
Figure 7-2: Scatter plot
That result let me use the information in the second article to correct its
mortality results to allow for adaptation. If, to take a simple example, the
corrected temperature for North America at the end of the century under RCP 8.5
is halfway between the uncorrected temperature for RCP 8.5 and the uncorrected
temperature for RCP 6.0 then the corrected mortality figure should be about
halfway between the mortality figures for the two emission paths. Generalizing
that, I can find for any region, date and RCP the corrected temperature and the
linear combination of uncorrected temperatures, typically of that RCP and the
next lower one,
that gives the same value. I then calculate the linear combination of
mortalities reported in Table S1 of the article using the same weights and use
that as my estimate of the corrected mortality.
Table 1 shows mortality results by region and emission path both from Table
S1 and corrected for adaptation as described above for the middle of the
century, Table 2 for the end of the century, both based on Table S1 of the
article.
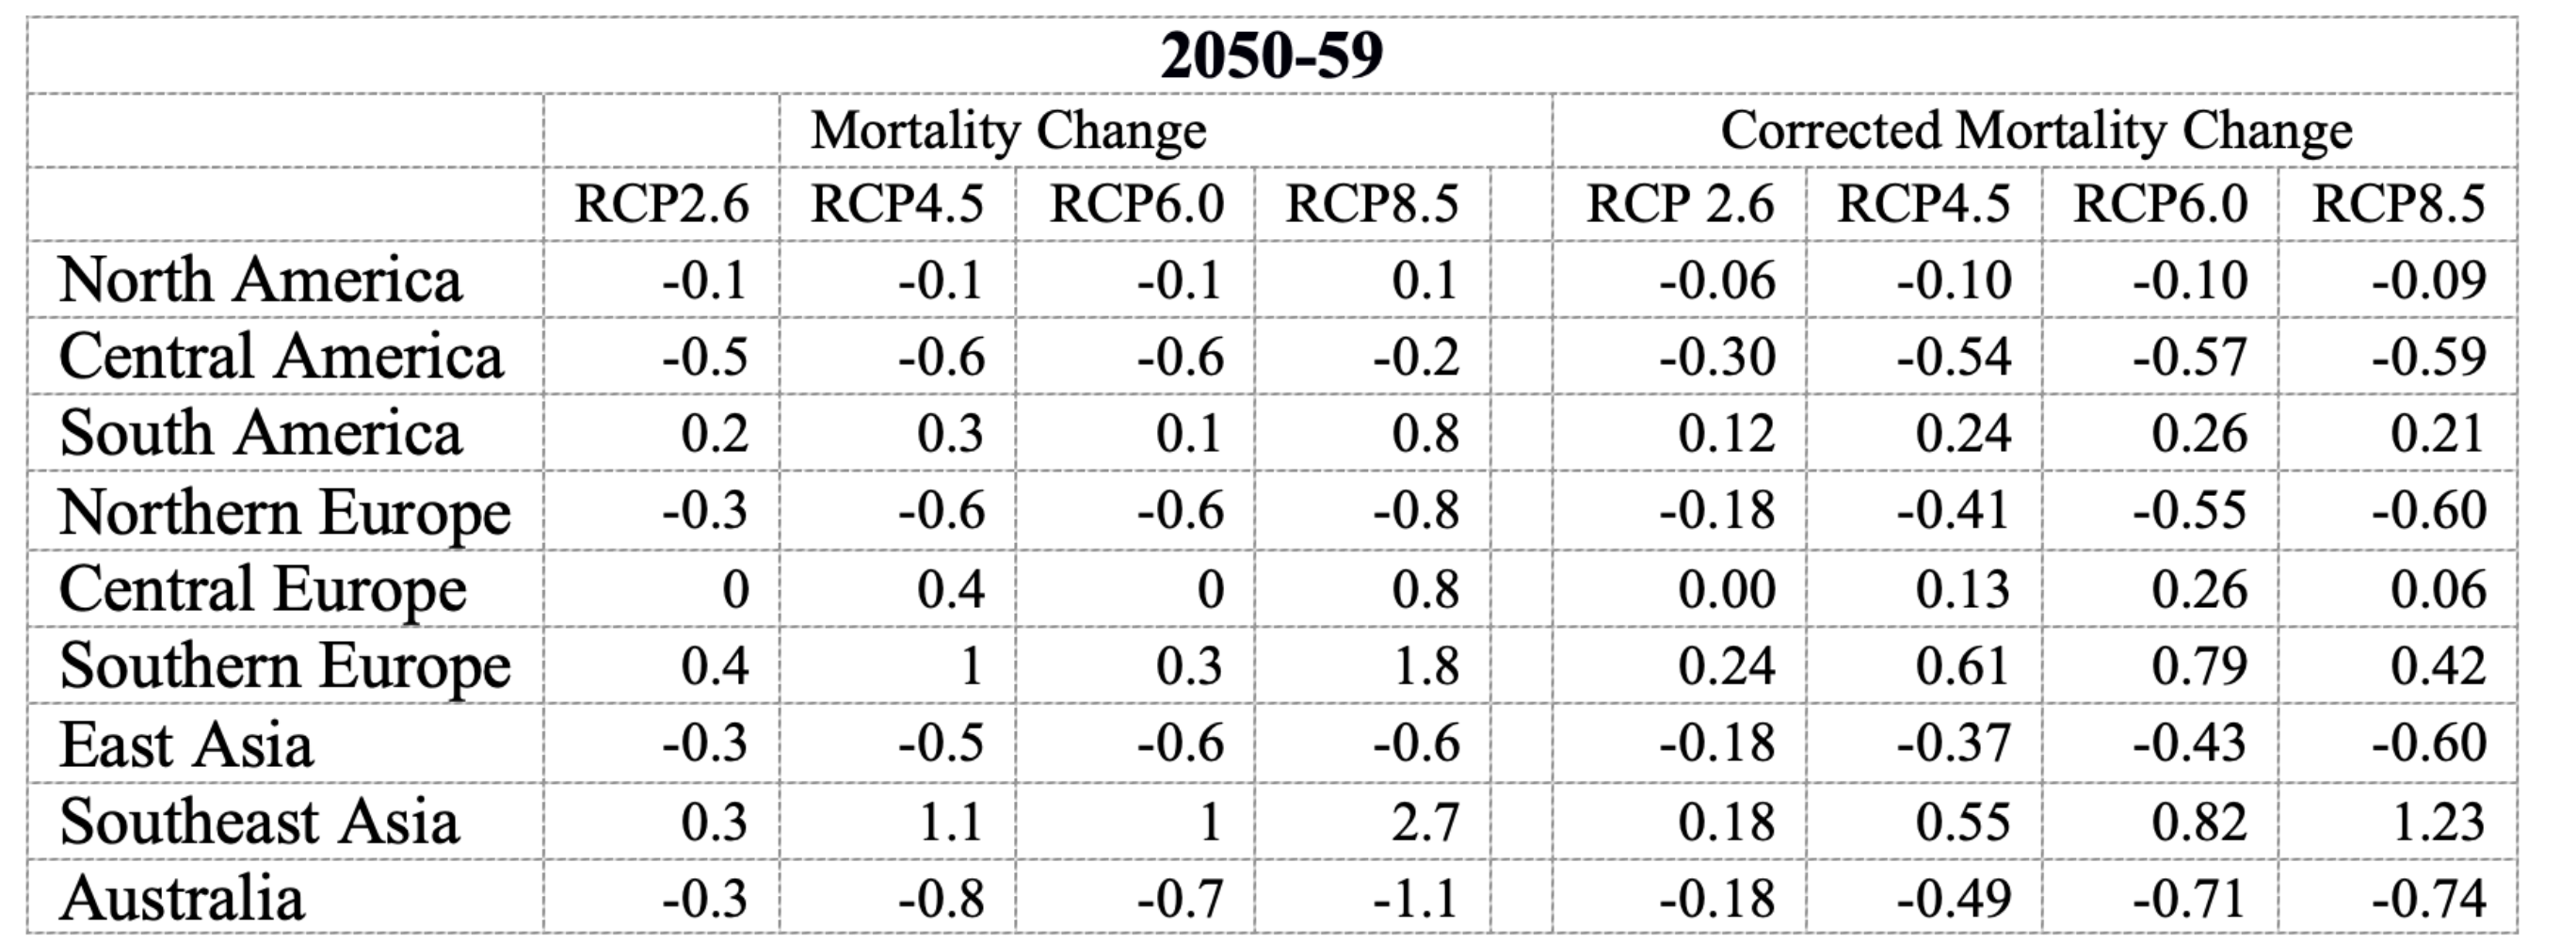
Table 7-1
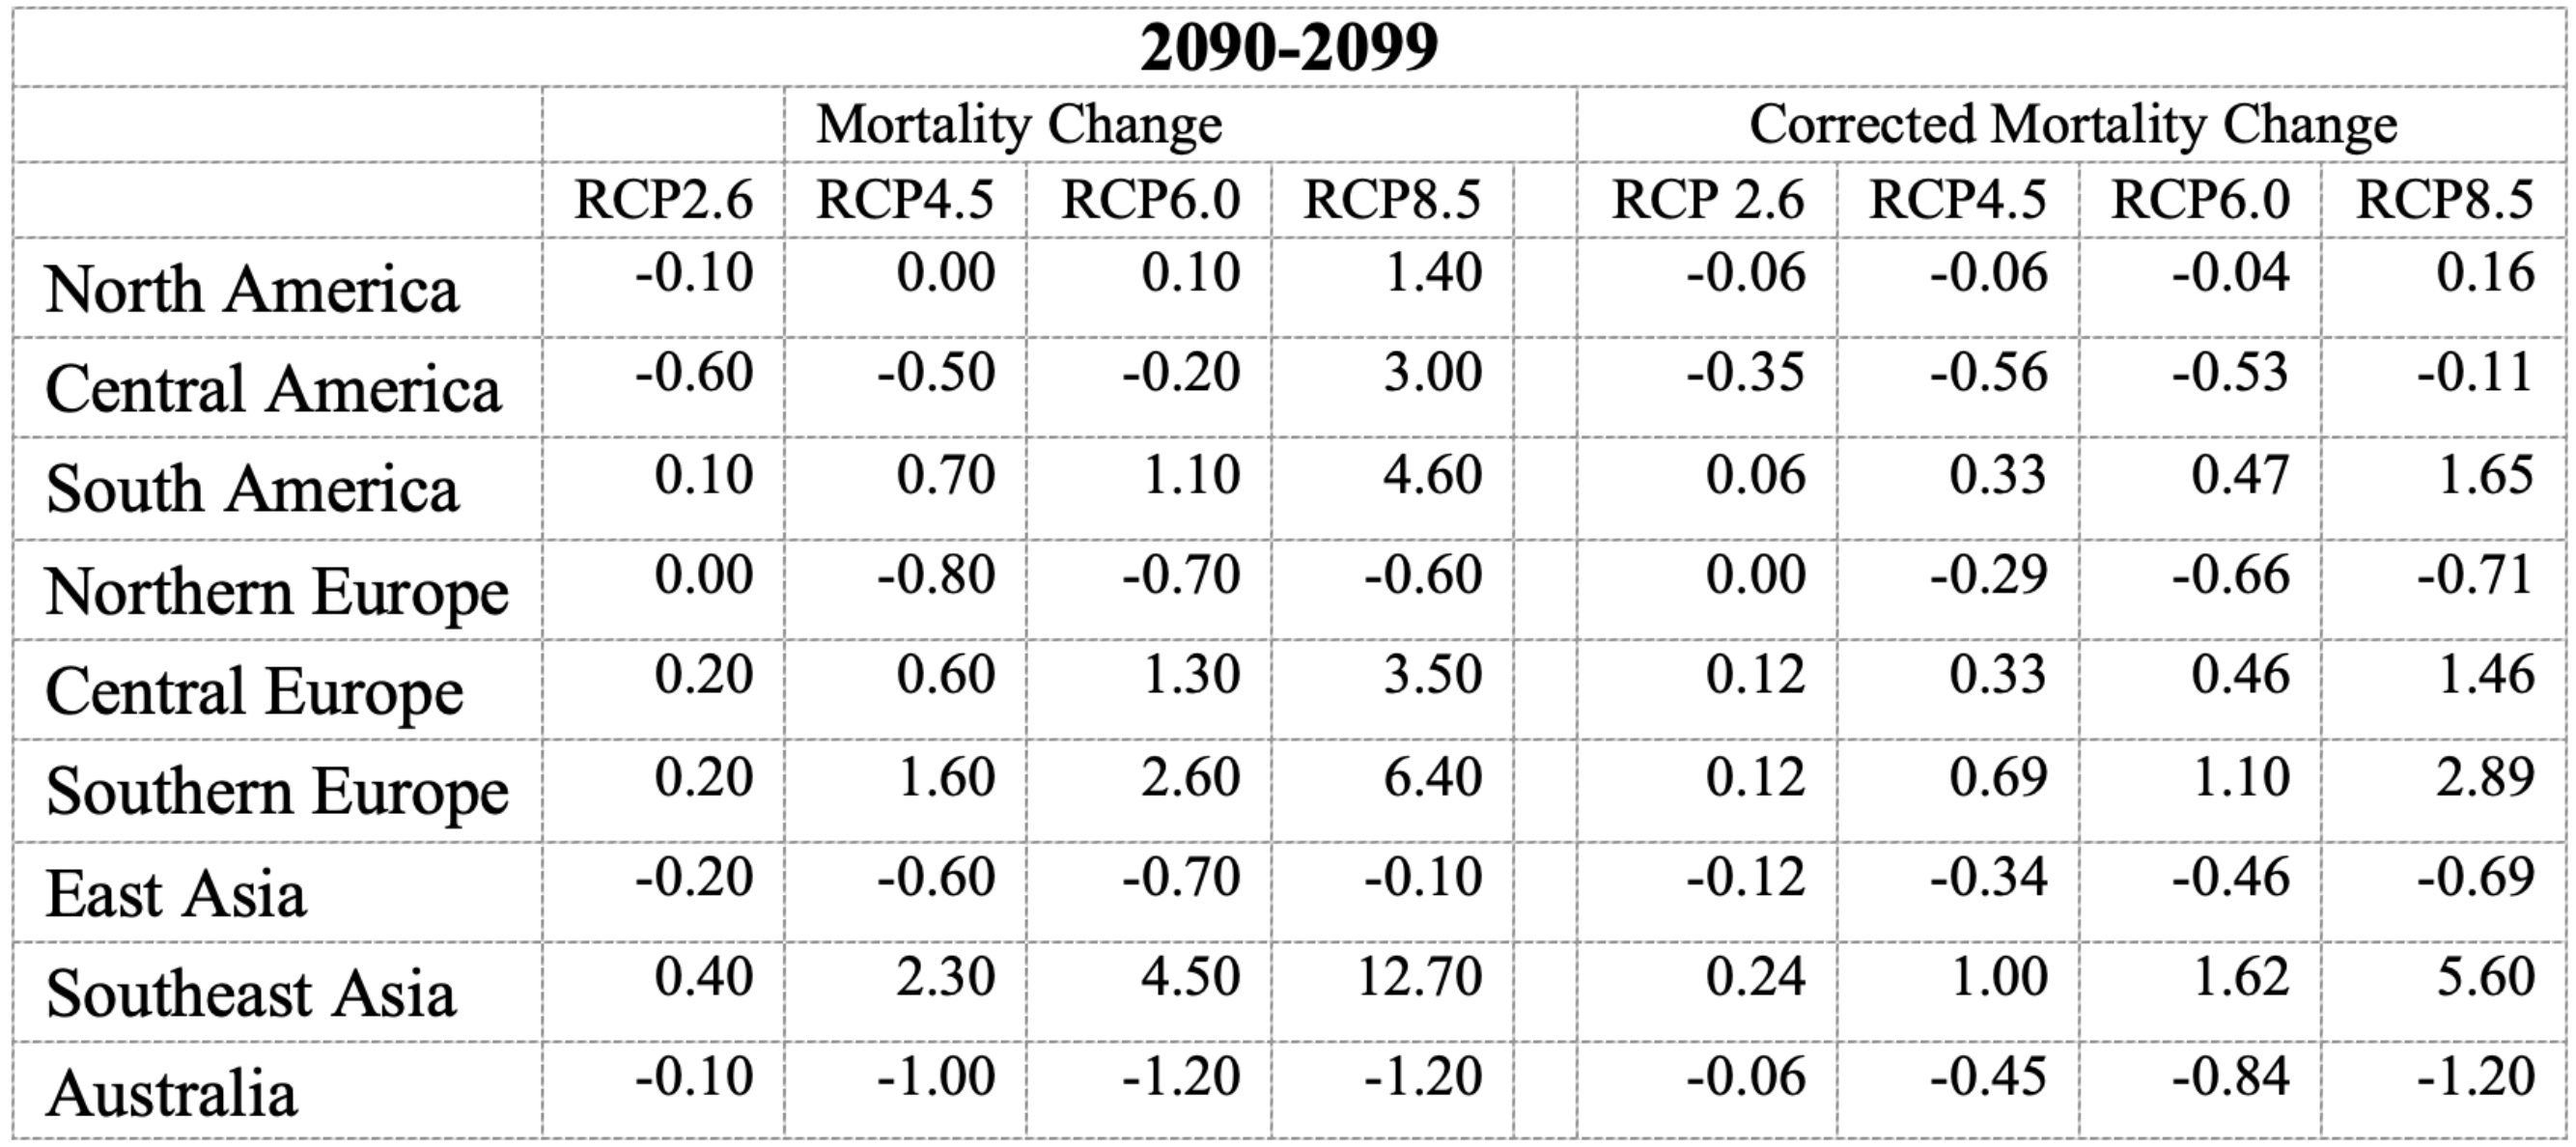
Table 7-2
Under RCP8.5 climate change by mid-century decreases mortality in four
of the nine regions, increases it in five, in the uncorrected version. In the
corrected version it decreases it in five, increases in four. By the end of the
century it decreases in three in the uncorrected version, four in the
corrected.
RCP 8.5 was originally designed as an upper bound to plausible emissions,
what happens if everything that can go wrong does, including population growth
that is not happening, so I take RCP6.0 as a more plausible guess at future
emissions assuming nothing major is done to hold them down. Under RCP 6.0
climate change by mid-century decreases mortality in five of the nine
regions, increases it in four, in both the corrected and uncorrected versions.
By the end of the century it decreases in four, increases in five, in the
uncorrected version, five and four in the corrected. Under RCP4.5, a more
optimistic guess at future emissions, the correction increases the number of
regions where mortality falls by the end of the century from four to five.
What about the total effect? To estimate that I multiply the effect in each
region by the region’s current population. That is not exactly right, since the
effect is a change in mortality due to temperature measured as a percentage of excess
mortality due to temperature, which will be different in different regions, but
I do not have the data to take account of that.
The numbers on the table are estimates of the percentage
increase in mortality times current population summed over regions. The sign
tells us whether the estimate is for an increase or decrease in mortality, the
size gives an estimate of the relative effect on mortality of different
emission paths or calculating with or without the adjustment for adaptation. To
go from that to an estimate of the average percentage increase in the world mortality
rate I divide that by the summed population of the regions, about 4.3 billion.
The ratio shown is the ratio of the size with to the size without my allowance
for adaptation. The result is a decrease in total mortality by mid-century, a
significantly larger increase by the century’s end, but considerably smaller
with adaptation than without.
|
|
2090-2099
|
|
|
|
RCP 2.6
|
RCP4.5
|
RCP6.0
|
RCP8.5
|
|
Unadjusted
|
-9.77E+07
|
1.04E+09
|
2.93E+09
|
1.32E+10
|
|
Adjusted
|
-5.76E+07
|
2.63E+08
|
6.08E+08
|
4.06E+09
|
|
Ratio
|
0.59
|
0.25
|
0.21
|
0.31
|
|
|
|
|
|
|
|
2050-59
|
|
|
|
Unadjusted
|
-3.12E+08
|
4.65E+07
|
-4.48E+08
|
1.51E+09
|
|
Adjusted
|
-1.84E+08
|
-2.07E+08
|
-9.13E+07
|
-2.11E+08
|
|
Ratio
|
0.59
|
-4.45
|
0.20
|
-0.14
|
|
Table 7-3
|
Adjusting the mortality figures to take account of adaptation does not
change the sign of the effect as of the end of the century; mortality
still decreases due to climate change for RCP2.6, increases for the other three,
but it substantially reduces the size of the effect, as shown by the ratio
between the adjusted and unadjusted effects. In mid-century the unadjusted
estimate shows a reduction in mortality for two of the four emission paths, an
increase for two; the adjusted estimates show climate change reducing mortality
for all four.
What about the effect for total mortality over the century, the integral of
the annual mortality rate? If we interpolate with straight lines and calculate
the area under them and use my adjusted figures, the change in total mortality
over the century due to warming is positive for RCP8.5 and RCP6.0, negative for
RCP4.5 and RCP2.6.
|
|
2090-2099
|
|
|
|
RCP 2.6
|
RCP4.5
|
RCP6.0
|
RCP8.5
|
|
Unadjusted
|
-9.77E+07
|
1.04E+09
|
2.93E+09
|
1.32E+10
|
|
Mortality rate
|
-0.02
|
0.24
|
0.68
|
3.07
|
|
Adjusted
|
-5.76E+07
|
2.63E+08
|
6.08E+08
|
4.06E+09
|
|
Mortality rate
|
-0.01
|
0.06
|
0.14
|
0.94
|
|
Ratio
|
0.59
|
0.25
|
0.21
|
0.31
|
|
|
|
|
|
|
|
2050-59
|
|
|
|
Unadjusted
|
-3.12E+08
|
4.65E+07
|
-4.48E+08
|
1.51E+09
|
|
Mortality rate
|
-0.07
|
0.01
|
-0.10
|
0.35
|
|
Adjusted
|
-1.84E+08
|
-2.07E+08
|
-9.13E+07
|
-2.11E+08
|
|
Mortality rate
|
-0.04
|
-0.05
|
-0.02
|
-0.05
|
|
Ratio
|
0.59
|
-4.45
|
0.2
|
-0.14
|
What is Left Out
The article takes no account of progress in either medical technology or the
technologies used to protect against heat and cold, most obviously home heating
and insulation. It takes no account of reductions in the effect of temperature
on mortality due to rising incomes. Both can be expected to reduce the size of
the mortality changes but not necessarily their sign, since they will reduce
both the increased mortality from heat and the decreased mortality from cold.
They do imply reductions in the size of the change that will be smaller in
later years. Since the effect on mortality is typically a reduction due to the
low levels of warming in the early years, an increase due to the higher levels
in the later years, that should reduce their sum, by how much I have no way of
knowing.
A more recent Lancet article,
with Gasparrini as one of the authors, measured the effect on mortality of
warming so far:
"Importantly, cold-related death decreased 0.51 per cent
from 2000 to 2019, while heat-related death increased 0.21 per cent, leading to
a reduction in net mortality due to cold and hot temperatures."
We would expect mortality due to either heat or cold to decrease with
income, since rich people are likely to have better insulated houses and less
need to go out in bad weather than poor. Gasparini et. al. 2017 ignores that
effect in its calculation of temperature related mortality as does Rennert et.
al. 2022, discussed in a later chapter. The latter article projects GNP per
capita, and so presumably income, rising about three-fold by 2100, about
eleven-fold by 2300.
What would we expect the effect of that to be on temperature-related
mortality?
Such data as we have suggests that the effect is likely to be large. Lay et
al., calculating temperature-related mortality rates first with 1973-82 data
and then with 2003-13 data, found that the predicted increase in
temperature-related mortality in the U.S. for a 2°C increase fell by more than
97%, for a 6°C increase by 84%, due to changes in mortality rates over thirty
years.
Data in Gasparini
et. al. 2015 can be used to give at least a rough answer to that question,
assuming as with adaptation that changes over time follow the same
pattern as over space. Mortality by location (mostly cities) is shown in Table
S4 of Gasparini 2015, average temperature in Harris
et. al. I have not yet found a source of per-capita income for all
locations in Table S4 but did find one online
for almost all of the US locations.1 With that data I can use a multiple regression with the
change in net mortality as the dependent variable, income per capita and
average temperature as the independent variables, to see how mortality changes
with income.2
I ran regressions both for the U.S. cities and for the full list of cities,
in the latter case attributing to each city the average income of the country
it was located in, both with income and log income as independent variables. My
results:
Using income and temperature as the independent variables, coefficients and
R2 are:
|
Income
|
Temperature
|
R2
|
|
US
Cities
|
-1.17E-05
|
-0.35
|
0.81
|
|
All
Cities
|
-4.29E-05
|
-0.33
|
0.44
|
Using log income and average temperature, coefficients and R2
are:
|
Log
Income
|
Temp
|
R2
|
|
US
Cities
|
-1.85
|
-0.35
|
0.89
|
|
All
Cities
|
-4.03
|
-0.33
|
.41
|
The regression coefficient for income lets me estimate how mortality would
change for a fixed increase, say ten thousand dollars a year. The coefficient
for log income lets me estimate the effect of multiplying everyone’s income by
a fixed amount. Since the estimates for income change over time in Rennert,
tripling by the end of the century, increasing eleven-fold by 2300, are of the
latter sort, I used the log income figures to estimate their effect.
The regression coefficient on log income for US cities implies that tripling
income will reduce the percentage increase in mortality by 1.85xlog3 = .9 .
Since the average increase in mortality for the US cities is 5.76 that
calculation suggests that Gasparini’s estimates of mortality by the end of the
century should be reduced by about 15% to allow for the effect of the income
increase and Rennert’s for mortality in 2300 by about 61%.
The all cities regression coefficient on log income gives a reduction,
calculated in the same way, by 1.9 for the end of the century, 4.2 by 2300. The
average for all cities is 6.35, which suggests that the mortality figure for
the end of the century should be reduced by about 30%, for 2300 by about 66%.
As I hope is obvious, these are very approximate estimates. The U.S. cities
figure shows the effect of income on mortality for a rich, developed society;
it might be quite different for China, India, or an African country.
The fact that the coefficient is much higher for the all cities regression
could reflect a larger effect of income in poorer countries but it might also
reflect the effect of using national income not city income; national income
may be a proxy for other features of a country that affect mortality. One
advantage of using cities from one country is that they are likely to vary less
in ways other than income and temperature than cities in different countries.
These are very approximate estimates but, I think, better than nothing.
What is being estimated in both Lancet articles is the effect of
one day’s temperature on the number of people who die during the next 21 days.
Including a 21 day lag avoids overestimating the mortality effect of one day’s
heat or cold by counting someone who dies that day but would have died anyway a
few days later — the “harvesting” effect. But it provides no way of telling
whether a death is of someone who would have died a month later or would have
lived for another forty years. Hence it provides no way of knowing how
many years of life are lost or gained due to the effect of climate change on
temperature.
If the data used in the articles included the age of each person who died we
could make a first cut at the problem by assuming that, absent temperature
related mortality, each person would have the average lifespan. I gather from
correspondence with Gasparini that he has such data for some cities so could,
perhaps will, see if deaths from cold are, on average, older or younger than
from heat.
Warming decreases deaths from cold, increases deaths from heat. If it turns
out that cold kills older people than heat it might turn out that climate
change reduces temperature-related mortality as measured in the articles but increases
number of years of life lost. If cold kills younger people, on the other hand,
the effect of warming is less bad than the articles imply.
One other complication ignored by both Gasparini and Rennert is the effect
on mortality of progress in technology, both medical technology and
technologies that affect the cost of temperature control. I have no good way of
estimating the size of that effect but, in my chapter on Rennert, offered
evidence from past reductions in mortality that it could be large.
All of the calculation are based on data from the recent past. The IPCC
projections take for granted continued economic growth, which should reduce
vulnerability to temperature. A second and more ambiguous problem is population
change. Increasing global temperature make presently warm areas less
attractive, presently cold areas more, so should produce some migration from
the former to the latter, reducing the overall mortality. The distribution of
population across regions can also be expected to change due to differing birth
rates, the effect of which over the next century is difficult to predict.
P.S.
If anyone reading this knows of a source of data on per capita income or
temperature variance by city that covers a large number of cities, let me know.
Either would let me substantially improve my calculations. If anyone wants to
duplicate my calculations and improve on them, perhaps by trying a wider
variety of functional forms, I will be happy to send you my data. It is all
from publicly available sources, mostly the Lancet articles, but it
took some effort to put it together.
… measurements made over the last few decades have
demonstrated that marine CO2 levels have risen, leading to an
increase in acidity. Ocean acidification is projected to adversely affect a
number of valuable marine ecosystem services by making it more difficult for
many organisms to form shells and skeletons.13
Some shellfish are highly vulnerable to ocean acidification and any impacts to
these species are expected to negatively affect the economy. (Climate
Action Benefits: Shellfish, EPA)
Shellfish shells are less likely to form in an acidic
environment, which compromises the future of this valuable high-protein,
low-fat food source. The evidence of ocean acidification in the Pacific
Northwest is compelling. (Shellfish
and Climate Change, Washington state Dept of Health)
Ocean acidification is already impacting many ocean species,
especially organisms like oysters and corals that make hard shells and
skeletons by combining calcium and carbonate from seawater. However, as ocean
acidification increases, available carbonate ions (CO32-)
bond with excess hydrogen, resulting in fewer carbonate ions available for
calcifying organisms to build and maintain their shells, skeletons, and other
calcium carbonate structures. If the pH gets too low, shells and skeletons can
even begin to dissolve. (Ocean
Acidification, NOAA)
The world’s shellfish are under threat as our oceans
become more acidic. (The
Conversation)
“Acidification,” the reduction of the pH of the ocean due to
absorbing CO2, sounds scary — acids are corrosive, so turning the
ocean acid is obviously bad for the things living in it. The problem with the
term, the argument, and the references to an acidic environment is that the
ocean is basic, pH greater than 7. Bases are corrosive too. Lowering the pH of
a base neutralizes it, makes it less basic. Only when pH gets below 7, which
would take about six hundred years at the present rate of decline, does the
water become acidic; distilled water, pH 7, is not an acid. “Neutralization”
sounds less scary than acidification but is a more accurate description of the
process.
That shows that the image of the ocean becoming acid is
wrong, that people who use it are either scientifically ignorant or trying to
exploit the ignorance of their audience, but it does not show that the
underlying argument is wrong. Organisms that live in the ocean are adapted to
its present conditions, including its present pH, so might function less well
if it became less basic. That is a legitimate argument even if presented with
dishonest rhetoric.
There are, however, several reasons to doubt that the effect
on oceanic organisms of the reduction that has occurred, or will in the
foreseeable future, is large and negative.
The first is that pH has varied considerably more in the
recent past than it is varying at present, although probably not as rapidly.
According to Extended Data Fig 1 in Rae et al., 2018, shown
below, pH calculated from boron isotope proxy measurements was about 7.4
nineteen thousand years ago. It is currently 8.04 and falling by about
.017/decade; at that rate it will take almost four hundred years for pH to get back
down to what it was nineteen thousand years ago.
Figure 1: (Rae et al., 2018, Extended
Data Figure 1).1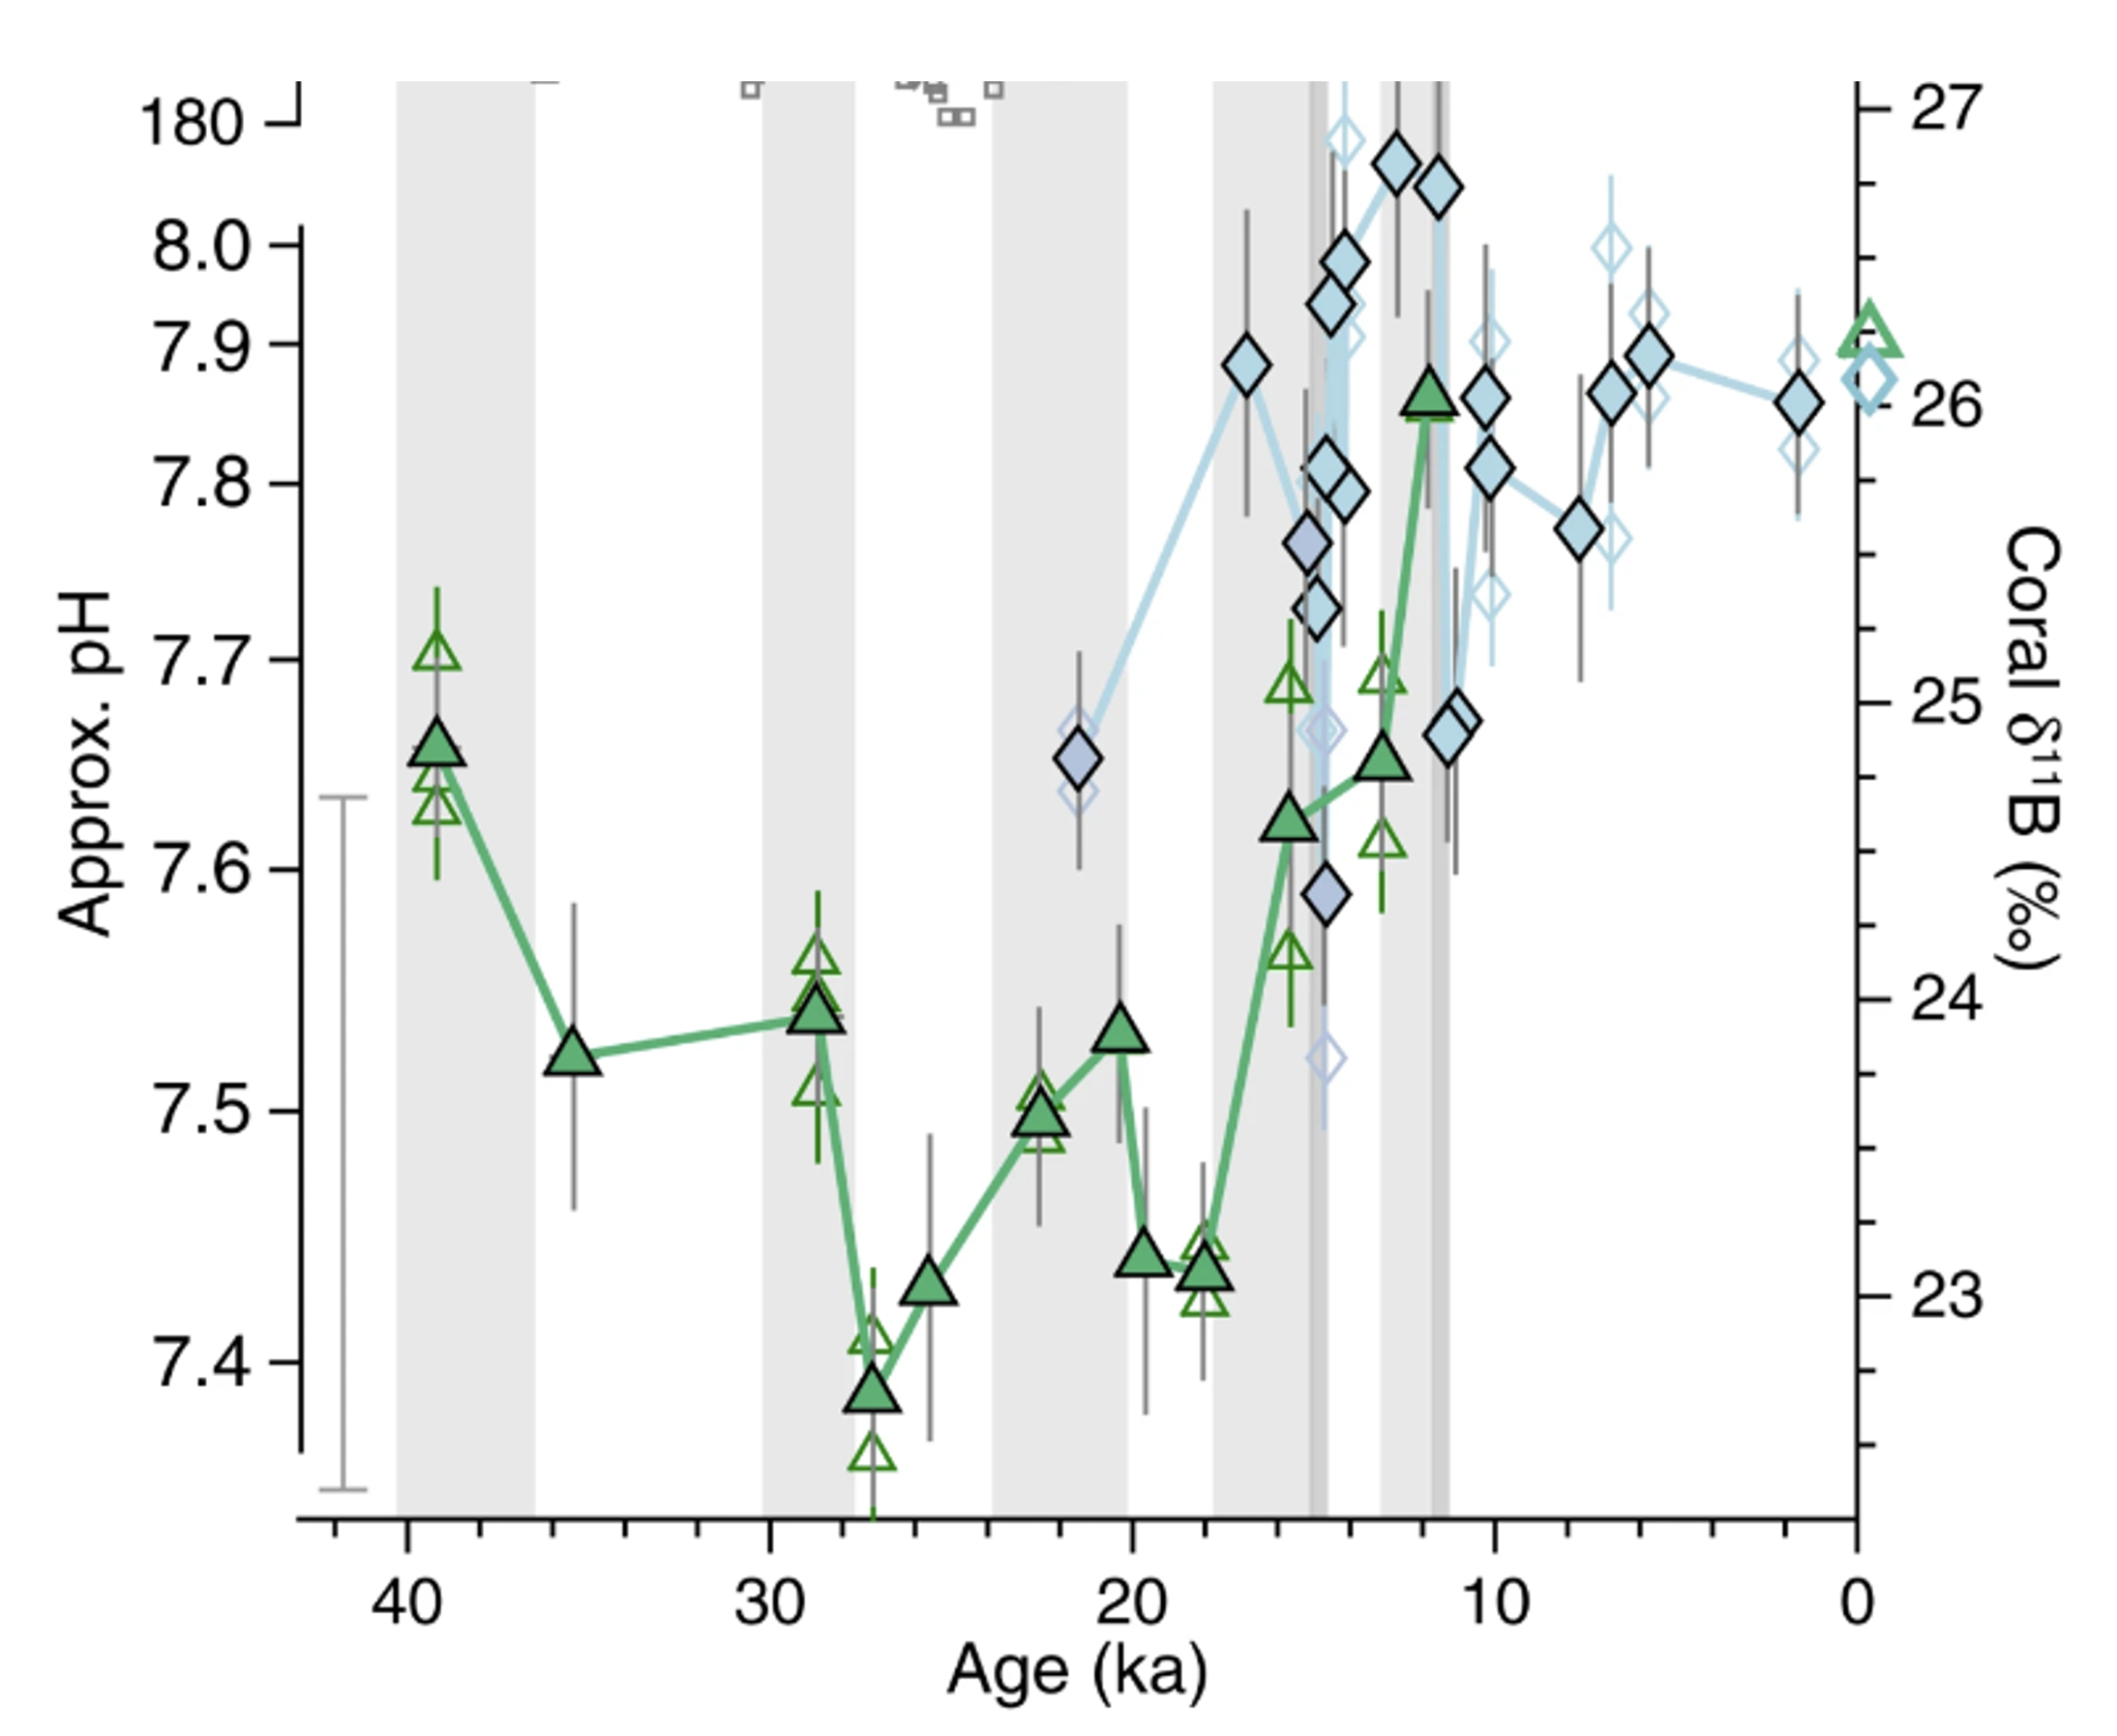
One form of the argument, seen in quotes above, is the claim
that “Ocean acidification is already impacting many ocean species, especially
organisms like oysters and corals that make hard shells and skeletons by
combining calcium and carbonate from seawater.”
The claim that current levels of pH and temperature are
affecting coral reefs is often supported with the case of the Great Barrier
Reef. Current data from the Australian Institute of Marine Science, however,
shows that its decline was temporary.
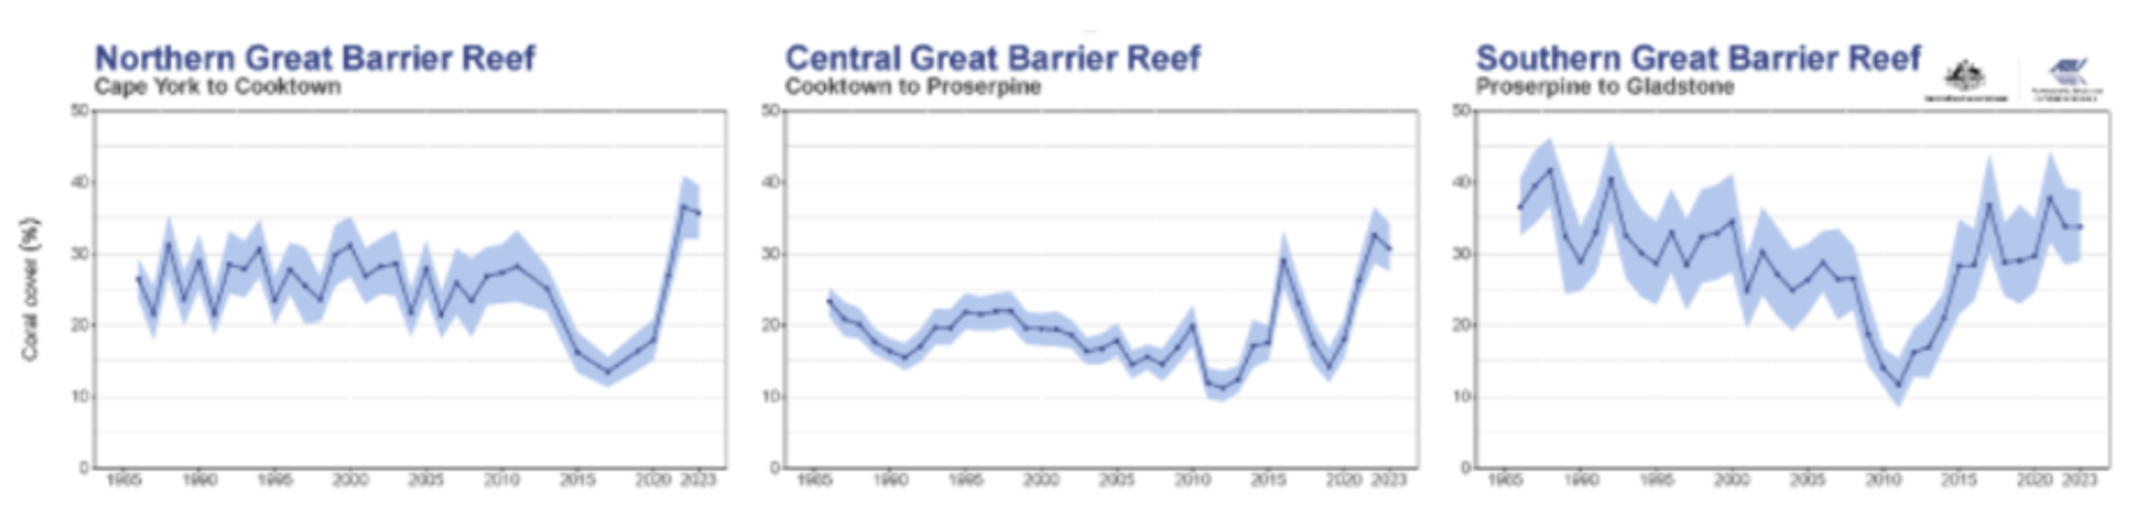 Figure 2: Hard coral cover of three
regions of the Great Barrier Reef 1985 to 2023, AIMS
2023.
Figure 2: Hard coral cover of three
regions of the Great Barrier Reef 1985 to 2023, AIMS
2023.
Further:
The Great
Barrier Reef Marine Park Authority (GBRMPA) considers the earliest evidence
of complete reef structures to have been 600,000 years ago. According to the
GBRMPA, the current, living reef structure is believed to have begun growing on
the older platform about 9,000 years ago. (Wikipeda, Great Barrier Reef)
Nine thousand years ago ocean pH was substantially lower
than it is at present (Figure 1). If the current living reef structure began
growing when ocean pH was 7.76 it is hard to see how it could have been
destroyed by pH falling to 8.04 due to the effect of human production of CO2.
Ocean acidification is already impacting many ocean species,
especially organisms like oysters and corals that make hard shells and
skeletons by combining calcium and carbonate from seawater.
So far as what is already happening, one might expect the
effect to have shown up in world production of mollusks, which has been
increasing Figure 3. That does not prove that the claim is false, since a mild
decline due to declining pH might be outweighed due to an increase from other
causes, but it is evidence against a large effect of declining pH on shellfish.
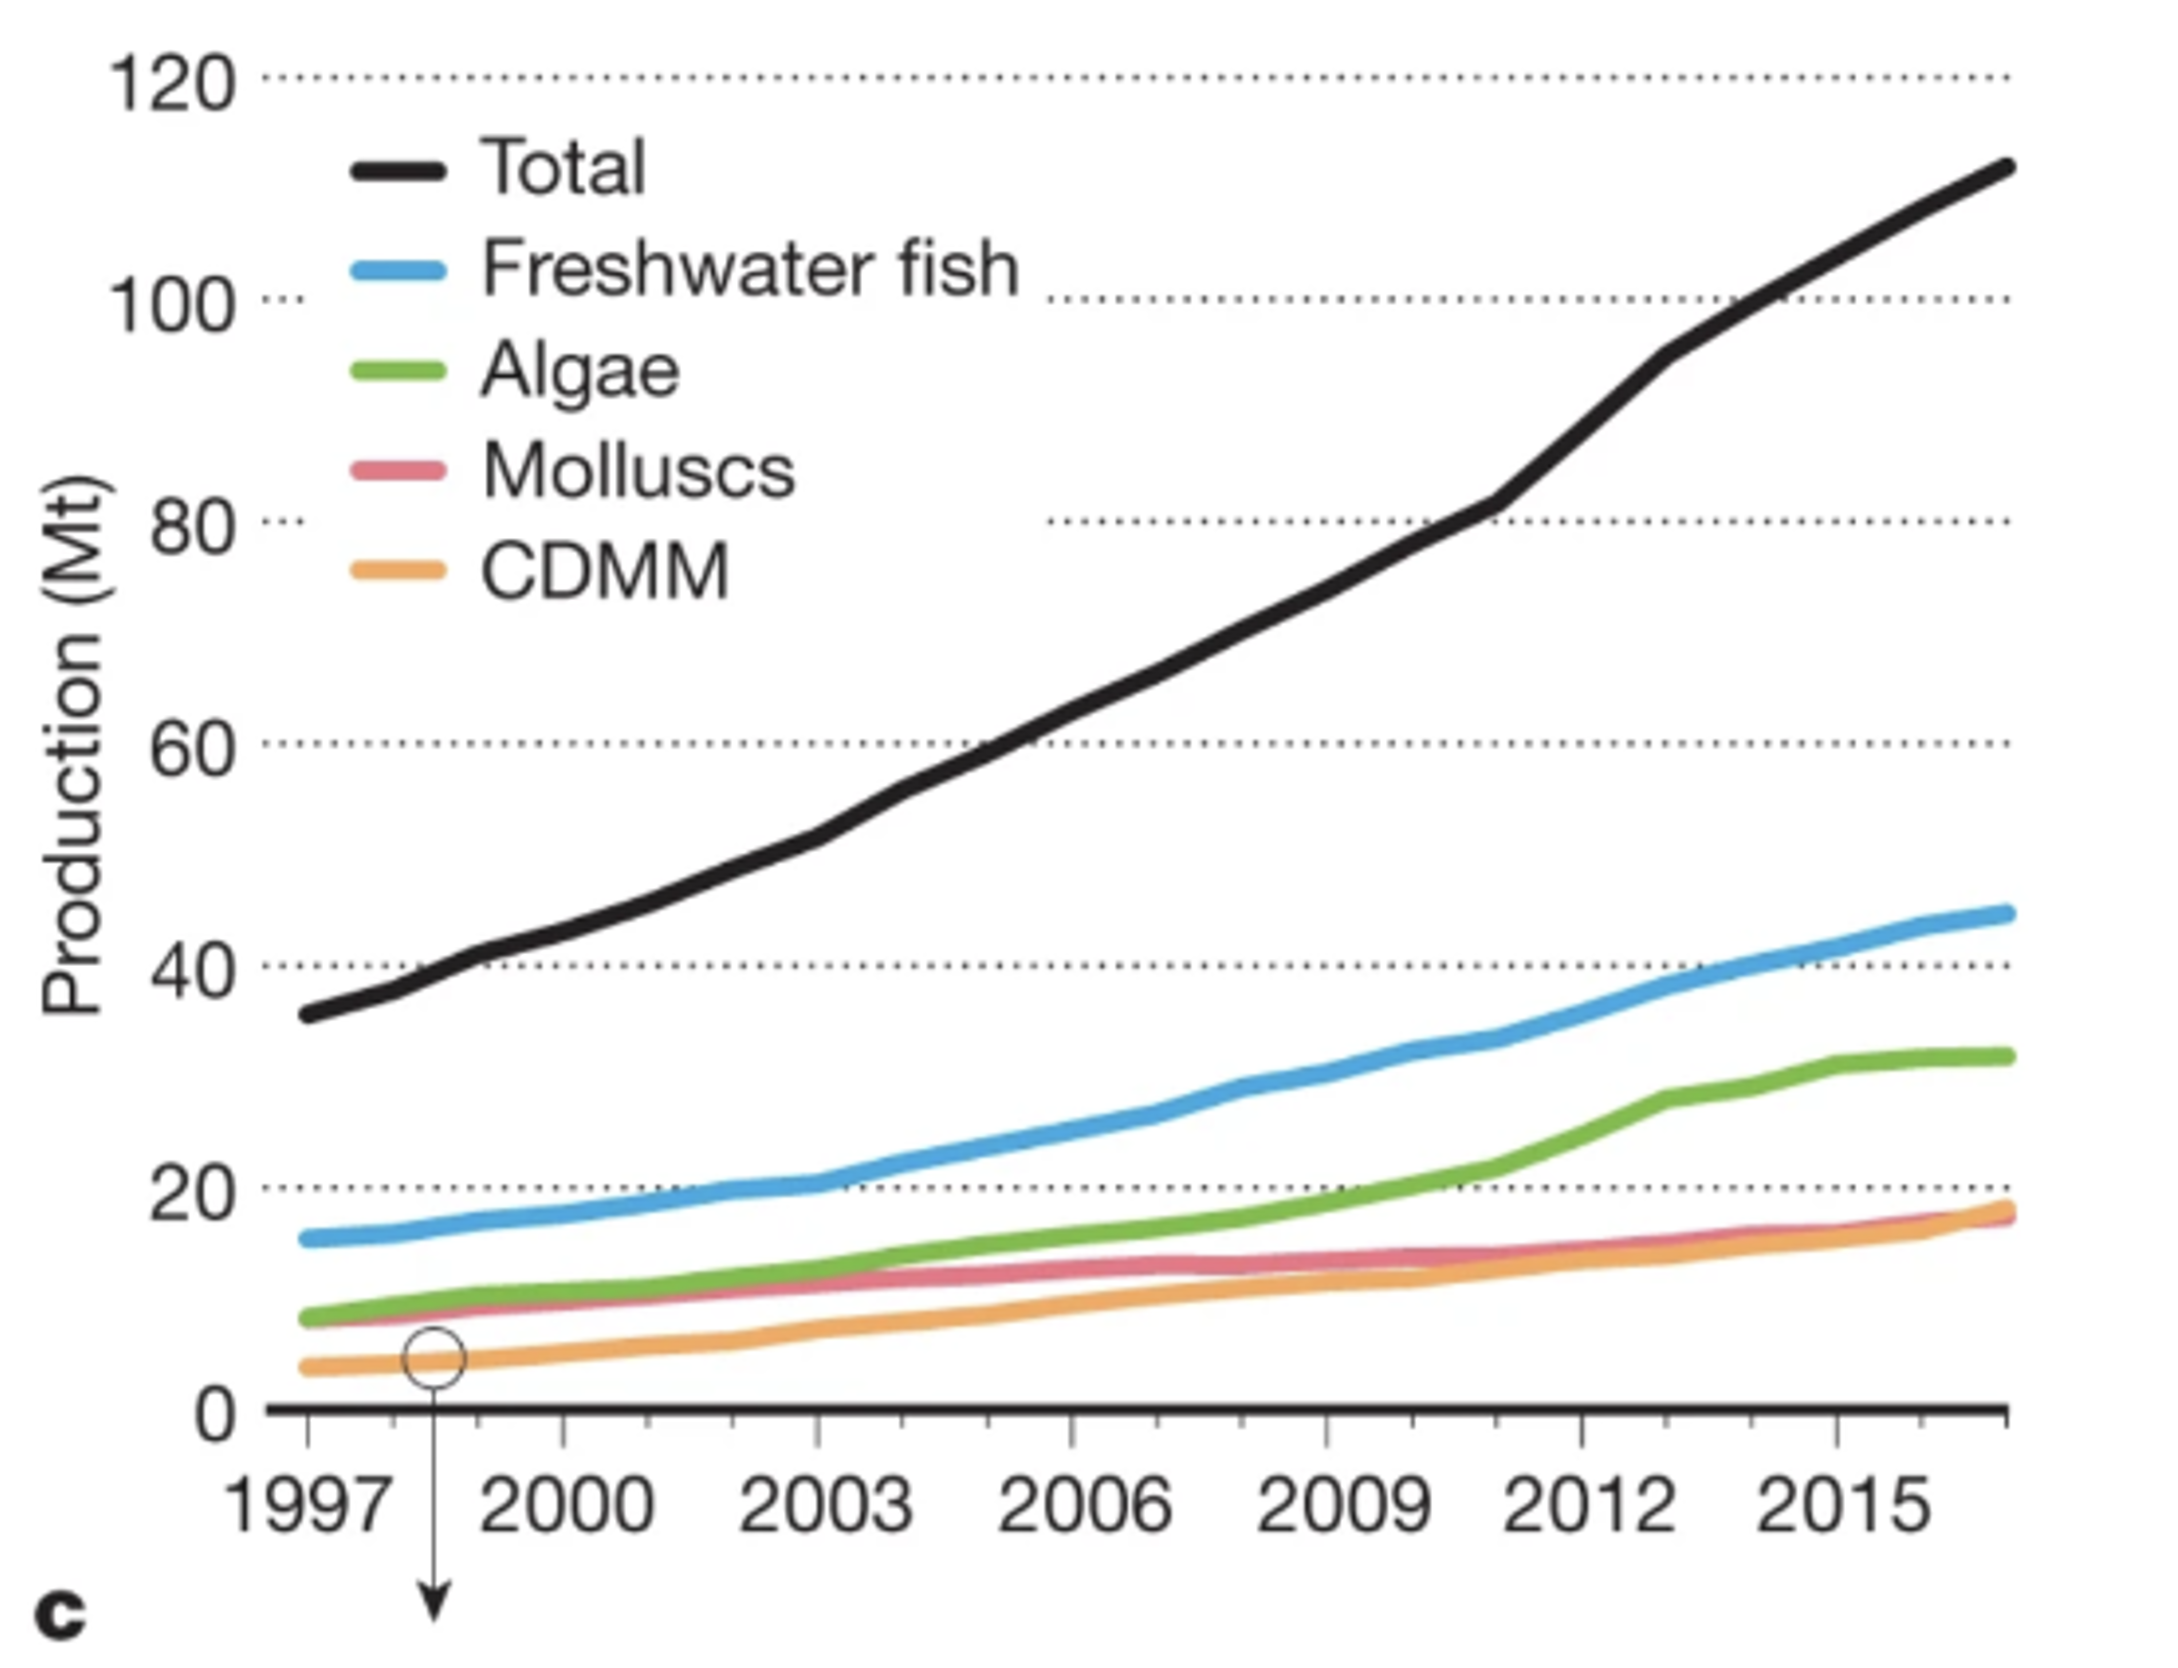 Figure
3 from A 20-year
retrospective review of global aquaculture, Nature 24 March 2021.
Figure
3 from A 20-year
retrospective review of global aquaculture, Nature 24 March 2021.
The reason to believe that climate change is a serious threat is not, for
most people, that they have evaluated the evidence for themselves. The reason
is that they have been told by multiple respectable sources that everyone
competent to hold an opinion on the subject agrees it is a threat, that that is
not a matter of serious debate.
Fifty years ago, population growth had the same status. Not all respectable
opinion agreed with the Ehrlichs’ prediction of unstoppable mass famine in the
1970’s, with hundred of millions dying of hunger, but almost everyone agreed
that unless something substantial was done to slow or stop population growth
the future would be grim, especially for poor countries.
In the fifty years since then population continued to grow. The rate of
extreme poverty declined sharply. Calorie consumption per capita in poor
countries went up. What happened was the precise opposite of what had been
confidently predicted. That does not tell us whether climate change is a
serious problem but it is evidence that the status of that belief as orthodoxy
is at most weak evidence that it is true.
We have been here before.
The next few chapters offer examples of work in support of the orthodoxy
that can be shown, with information readily available to you, to be bad enough
that it should not have been published, work that was not only published but
widely accepted. That does not tell us what the correct conclusion about the
effects of climate change is — insofar as I can do that at all I did it in the
previous sections — but it is evidence that the mechanisms for filtering out
dishonest or incompetent work in the respectable climate change literature are
badly broken.
Cook et.
al. (2013) is the paper, possibly one of two, on which the often repeated
claim that 97% of climate scientists believe in global warming is based. Legates et.
al. (2013) is a paper which criticizes Cook et. al. (2013). Bedford
and Cook (2013) is a response to Legates et. al. All three papers (the last
a pre-publication version) are webbed, although Legates et. al. is
unfortunately behind a pay wall.
Bedford and Cook (2013) contains the following sentence: "Cook et al.
(2013) found that over 97% endorsed the view that the Earth is warming up and
human emissions of greenhouse gases are the main cause."
To check that claim, look at Cook et. al. 2013.
Table 2 shows three categories of endorsement of global warming reflected in
the abstracts of articles. Category 1, explicit endorsement with
quantification, is described as "Explicitly states that humans are the
primary cause of recent global warming." Category 2 is explicit
endorsement without quantification. The description, "Explicitly states
humans are causing global warming or refers to anthropogenic global
warming/climate change as a known fact" is ambiguous, since neither "causing"
nor "anthropogenic global warming" specifies how large a part of
warming humans are responsible for. The example for the category is clearer:
'Emissions of a broad range of greenhouse gases of varying lifetimes contribute
to global climate change.” If human action produces ten percent of warming it
contributes to it, hence category 2 does not specify how large a fraction of
the warming humans are responsible for. Category 3, implicit endorsement, again
uses the ambiguous "are causing," but the example is '...carbon
sequestration in soil is important for mitigating global climate change,' which
again would be consistent with holding that CO2 was responsible for
some but less than half of the warming. It follows that only papers in category
1 imply that "human emissions of greenhouse gases are the main
cause." Authors of papers in categories 2 and 3 might believe that, they
might believe that human emissions of greenhouse gases were one cause among
several.
Reading down in Cook et. al., we find "To simplify the analysis,
ratings were consolidated into three groups: endorsements (including implicit
and explicit; categories 1–3 in table 2)." It is that combined group,
("endorse AGW" on Table 4) that the 97.1% figure refers to. Hence
that is the number of papers that, according to Cook et. al., implied that
humans at least contribute to global warming.
A commenter on my blog located the data
file for Cook et. al. (2013). The number of articles classified into each
category was:
Level 1 = 64
Level 2 = 922
Level 3 = 2910
Level 4 = 7970
Level 5 = 54
Level 6 = 15
Level 7 = 9
The 97% figure was the sum of levels 1-3. That 97% breaks down as:
Level 1: 1.6%
Level 2: 23%
Level 3: 72%
Only Level 1 corresponds to "the Earth is warming up and human
emissions of greenhouse gases are the main cause." It follows
that the sentence I quoted from Bedford and Cook is false. Cook et. al. did not
find that "over 97% endorsed the view that the Earth is warming up and
human emissions of greenhouse gases are the main cause."
(emphasis mine). He found that 1.6% did. It is possible, indeed likely, that
more do, but that was not what the article found.
In online exchanges on climate, I repeatedly encountered the claim that 97%
of climate scientists believed humans were the main cause of global warming.
That included an exchange with one of the very few reasonable and civil
supporters of the claim that global warming would be catastrophically bad that
I encountered in the online arguments, where most participants on either side
are neither reasonable nor civil.
The paper appears designed to encourage that misreading by lumping together
categories 1-3 and reporting only the sum. It repeatedly refers to "the
consensus" but the closest it came to defining that is as the
"position that humans are causing global warming" — which leaves it
unclear whether "causing" means "are one cause of,"
"are the chief cause of," or "are the sole cause of." To
discover that it meant only the former a reader had to pay sufficiently careful
attention to the details of the paper to notice the examples for categories 2
and 3, which few readers would do. The fact that Cook chose in a second paper
to misrepresent the result of the first is good evidence that the presentation
of his results was deliberately designed to mislead. Hence the sentence in
question is a deliberate lie, a fact that any interested reader can check by
simply comparing the two papers of which Cook is a co-author, both webbed.
That Cook misrepresents the result of his own research does not tell us
whether AGW is true or how dangerous it is. It does not even tell us if most
climate scientists believe that humans are the main source of climate change.
But beliefs on either side depend largely on what sources of information you
trust and I have now provided unambiguous evidence, evidence that anyone who is
willing to carefully read Cook (2013) and check what it says against what
Bedford and Cook claims it says can verify for himself, that John Cook is
willing to deliberately lie in print about his own work.
The blog Skeptical Science lists John Cook as its maintainer, hence
all claims on that blog ought to be viewed with suspicion and accepted only if
independently verified. Since, as a prominent supporter of the position that
warming is primarily due to humans and a very serious threat, Cook is taken
seriously and cited by other supporters of that position, one should reduce
one's trust in those others as well. Either they too are dishonest or they are
unduly willing to believe false claims that support their position.
The fact that one prominent supporter of a position is dishonest does not
prove that the position is wrong. For all I know, there may be people on the
other side who could be shown to be dishonest by a similar analysis. But it is
a reason why those who support that side because they trust its proponents to
tell them the truth should be less willing to do so.
John Cook eventually responded to my criticism, not on my blog but on the comment
thread of one that linked to mine. He wrote:
As lead author of the Cook et al consensus paper, I can
demonstrate how David Friedman ginned up a false contradiction by quoting me
out of context. Here is the full line from the Bedford & Cook paper:
Of the 4,014 abstracts that expressed a position on the issue
of human-induced climate change, Cook et al. (2013) found that over 97 %
endorsed the view that the Earth is warming up and human emissions of
greenhouse gases are the main cause.
To generate the 'contradiction', Friedman omits the first
portion of the sentence:
Cook et al. (2013) found that over 97 % endorsed the view
that the Earth is warming up and human emissions of greenhouse gases are the
main cause.
I agree entirely with the OP's assertion of checking what
writers say and see what their statements are based on. In this case,
Friedman's criticism is based on misrepresentation of my original text. I find
it extraordinary that Friedman accuses me of a deliberate lie while misquoting
my work (deliberately? You decide). It is also ironic that a theme of this post
is checking writing for falsehoods while uncritically repeating his
misrepresentation.
That would be a legitimate response if my criticism had been of the fact
that his 97% figure ignored the roughly two-thirds of papers whose abstracts
took no position on AGW. But, as you can easily check from my blog
post, that is not what I objected to. My objection was that the 97% figure
lumped together categories 1-3 when only category 1 fitted Cook's "main
cause." Category 1 contained 64 papers, 1.6% not 97%. Cook indignantly
responded to a criticism I did not make, ignored the criticism I did make, and
offered a defense entirely irrelevant to my criticism.
That left me with a puzzle: was he a rogue or a fool? Was he trying to
mislead careless readers who, by the time they had gotten to his response, had
forgotten what my criticism was, or readers sufficiently committed to his side
that they would assume what he wrote was true without bothering to check either
my post or David Henderson’s account of my argument? Alternatively, is he so
incapable of reading and understanding criticism that he confused the point
about the two thirds who expressed no opinion, raised by David Henderson in his
piece commenting on mine, with my argument which David Henderson accurately
reported? Is he unaware of the trick he himself pulled by pooling the three
categories and reporting only the sum? It seems hard to believe. What, after
all, was the point of separately looking at the three categories if he was not
going to report the results?
One piece of evidence in favor of the rogue theory is that he posted his
response on David Henderson’s blog instead of mine, making it less likely that
readers of it would have read my post. One piece of evidence in favor of the
alternative is that he offered a transparently fraudulent rebuttal to my
argument instead of remaining prudently silent.
It is not surprising if there are some dishonest people on one side, the
other, or both of the climate controversy. A more interesting question is
whether there are any honest people. Are there any prominent supporters of the
need for strong action to prevent warming who have publicly rejected Cook et.
al. 2013 or its author?
The closest I have found is Richard Tol, a Dutch economist who was one of
the IPCC authors and has webbed his own criticisms
of Cook et. al 2013. Tol, however, has published estimates of the cost of
warming suggesting that it is negative at low levels and positive but not
catastrophic at high levels and eventually resigned from the IPCC in protest
against some of its positions. Although he almost certainly believes that
warming is real and in large part anthropogenic, as do I, he cannot be counted
as clearly on Cook’s side of the argument.
I may have missed someone but so far, assuming I have not made a mistake in
the analysis so far, there appears to be nobody on Cook’s side of the climate
argument who is sufficiently concerned with truth to have noticed, and publicly
reported, that a much quoted factoid on his side is a lie.
Diner: "Waiter, it says hasenpfeffer on the
menu. Is it really rabbit?"
Waiter: "Yes, sir."
Diner (suspicious): "All rabbit?"
Waiter: "There's a little veal in it too."
Diner (still suspicious): "How much veal?"
Waiter: "Fifty-fifty."
Diner: "Fifty-fifty? Just what does that mean?"
Waiter. "Fifty-fifty. One of each."
Introduction to Modern Climate Change by Andrew Dessler is an
elementary climate science textbook, now in its third edition. In Chapter 9,
“Impacts of Climate Change,” it has:
Scientists
predict that sea level will rise 47 to 73 cm (19 to 29 inches) above
1995–2014 levels by 2100. This may not sound like a significant
challenge, but it is much larger than the 18 cm of sea level experienced over
the twentieth century, which is already challenging for many who live near sea
level. Like temperature, these predictions of sea-level rise might sound
small but, also like temperature, they are not. In Florida, for example, a
sea-level rise in the middle of the projected range would inundate 9 percent of
Florida’s current land area at high tide.6 This includes virtually all of the
Florida Keys as well as 70 percent of Miami-Dade County. Almost one-tenth
of Florida’s current population, or nearly 2 million people, live in this
vulnerable zone, and it includes residential real estate valued at hundreds of
billions of dollars. It also includes important infrastructure, such as two
nuclear reactors, three prisons, and 68 hospitals.
That struck me as implausible, given what else I had seen on the effect of
sea level rise. The footnote for the claim was to Stanton and Ackerman (2007),
which turned out to be not a peer reviewed journal article but a report
commissioned by the Environmental Defense fund, an environmentalist group. It
includes the same claims but for 27 inches of Sea-level rise not the 24 inches
that is Dessler’s “middle of the projected range.” It refers the reader to
Appendix C for “detailed sources and methodology.” Going there, I found:
To estimate the impact of sea-level rise on land area,
populations, and public and private assets and infrastructure, we began with a
1:250,000 Digital Elevation Model (DEM) map of the State of Florida, and
divided the state into “vulnerable” and “not vulnerable” zones demarcated by
1.5 meters of elevation and other factors described by Titus and Richman (2000)
as corresponding to 27 inches of sea-level rise.
So what they are showing as the vulnerable area is not the 27 inch or 24
inch contour but the 1.5 meter (5 feet) contour. The explanation, from Titus,
J. G. and C. Richman (2001).
“Maps of lands vulnerable to sea level rise: modeled elevations along the US
Atlantic and Gulf coasts.” Climate Research 18: 205–228, a journal article
written by two EPA people and presumably peer reviewed:
Thus, at a typical site, the 1.5-meter contour would be
flooded by spring high tides (i.e., high tides during new and full moons) when
sea level rises 80 cm
Figure 1 below (Titus and Richman Figure 4) is a map of Florida with the
region within the 1.5 meter contour colored red, the region between 1.5 and 3.5
blue. Dessler’s middle of the projected range is 60 cm. Stanton and Ackerman’s
27 inches is 68.6 cm. The map shows what its authors claim would be flooded, at
spring high tides, by 80cm of sea level rise.
Figure 2 below is a population density
map of Florida from Wikipedia to which I have added the 1.5m contours from
Figure 1. The large flooded area on the southern tip of Florida includes none
of the densely populated area around Miami; only one of the tiny areas farther
north appears to be in part on a populated area. That is not surprising — areas
very close to sea level are likely to be marsh, in this case the everglades,
and poor places to build on.
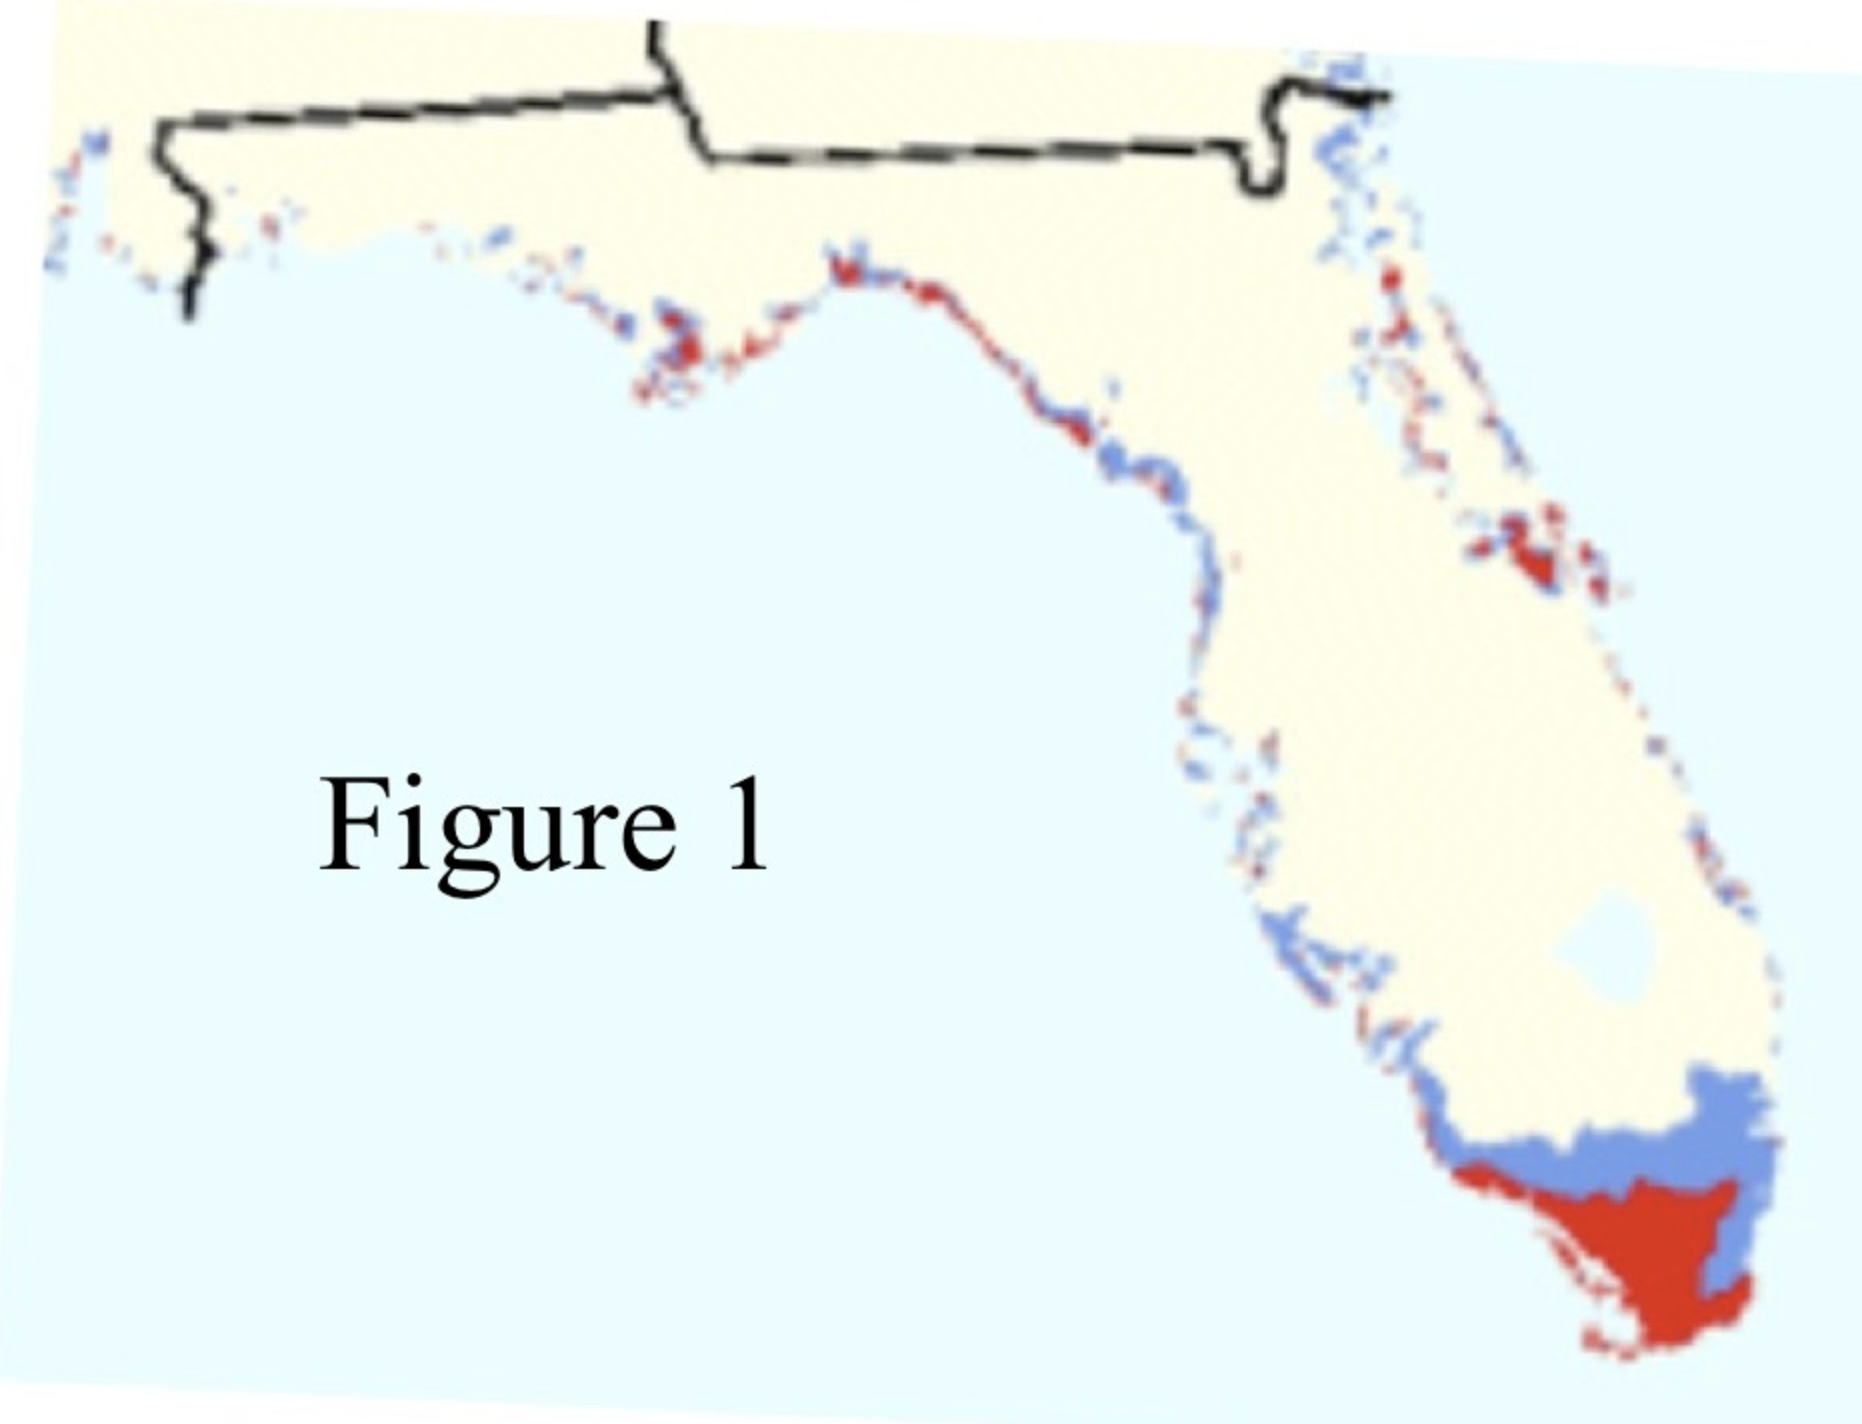
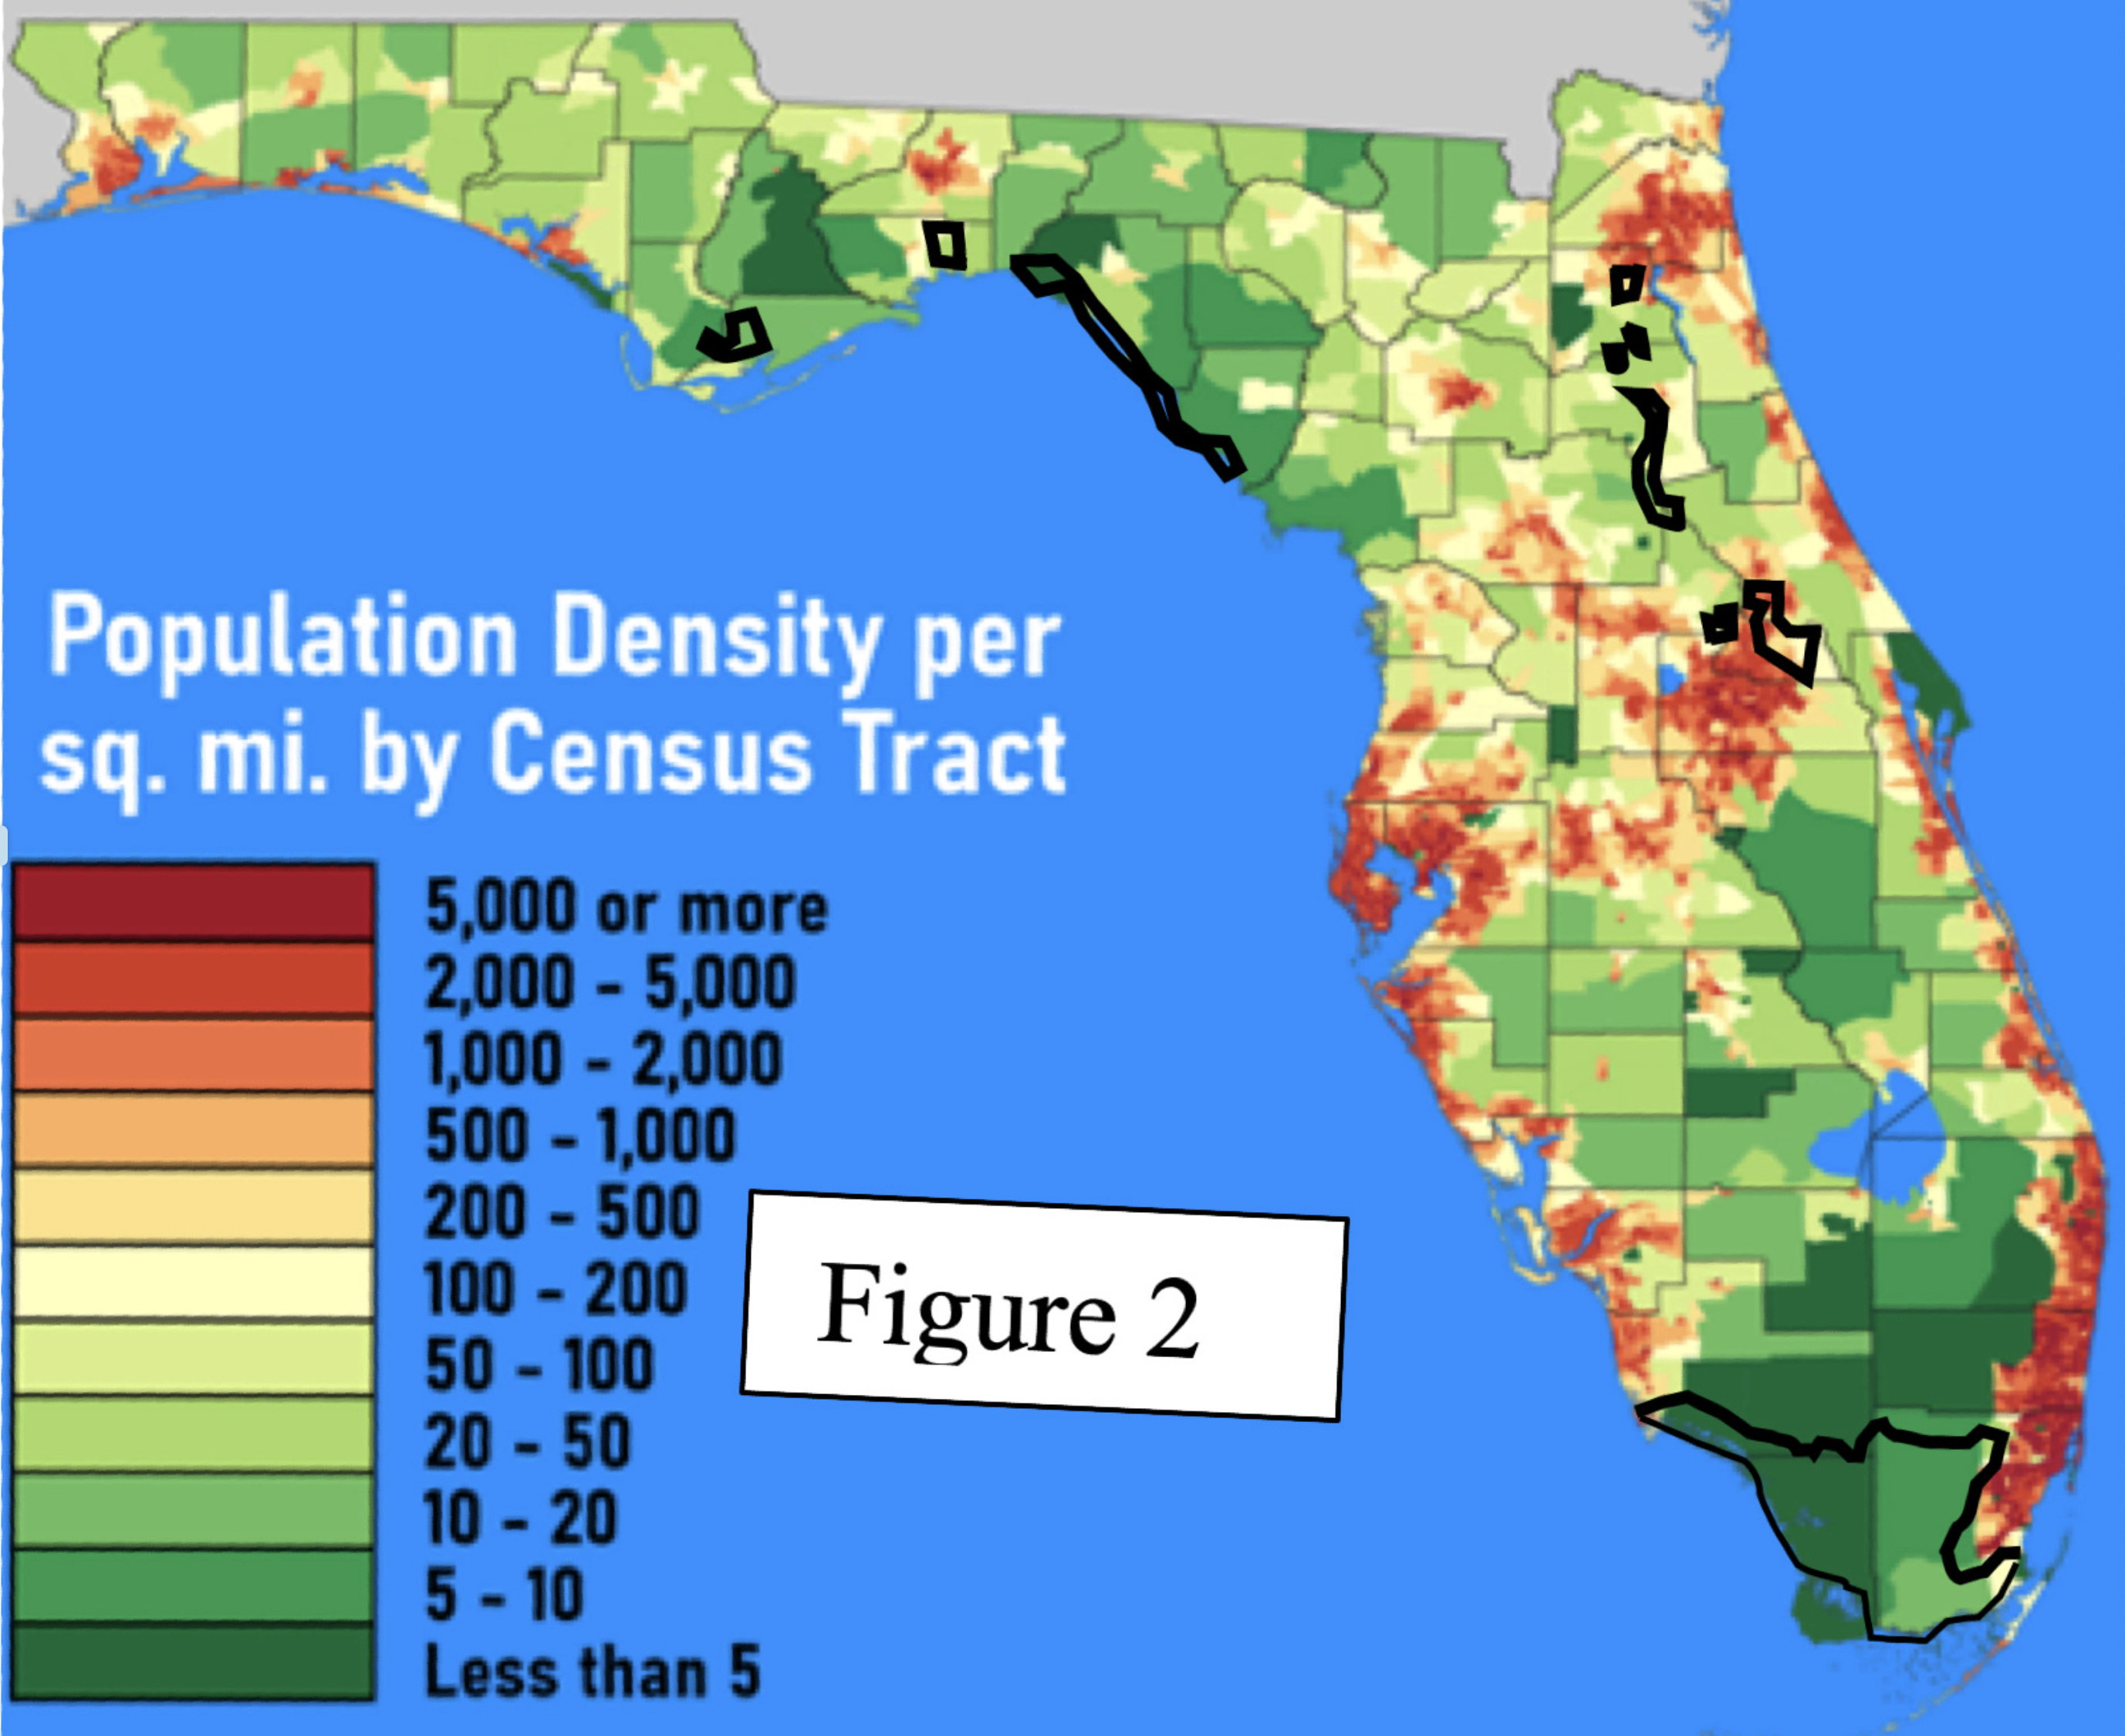
Stanton and Ackerman claim that their own calculations,
using data bases of elevation and population, produce a total population in the
at-risk area of 1.5 million. That was the figure Dessler gave in his first
edition, presumably increased to almost 2 million in the third edition to
reflect the increase in Florida’s population. Figure 2 shows why I don’t
believe it. The flooded areas are in places almost all of which have very low
population density, making it hard to see how flooding nine percent of the land
area, most of it in the everglades, can flood almost ten percent of the
population. Even if all of the Florida Keys, not shown on the figures, are
flooded, their total population is only about 80,000.
That problem is in addition to the fact that Dessler’s claim is for 60 cm of
sea level rise, Stanton and Ackerman’s, from which Dessler got his figure for
how many people are flooded, is for 68.6 cm (27 inches), and Titus and Richman
get the 1.5 m contour that Stanton and Ackerman say they are using by assuming
80cm of sea level rise. Further reasons for suspicion are that Stanton and
Ackerman gave figures for sea level rise substantially higher than either the
IPCC figure at the time or the current IPCC figure, which suggests that they
were trying to make the consequences of climate change look as scary as
possible, and that they write “1.5 meters of elevation and other factors
described by Titus and Richman (2000) as corresponding to 27 inches of sea-level
rise” when Titus and Richman actually describe 1.5 meters as corresponding to
80 cm (31.5 inches) of sea level rise.
I can see three possible explanations:
1. I have made a mistake in my calculations and Dessler’s claim is true.
After discovering the apparent error I emailed Dessler describing it. He
replied and we had a couple of rounds of exchanges. He appeared to concede that
his 60 cm might be wrong, said he would have someone look into the other part
of my criticism.
2. His statement is a noble lie, a deliberate falsehood told to produce good
consequences, in this case to persuade students that climate change is a
terrible threat. He denied that and, after interacting with him, I think it
unlikely.
3. Having found a claim he liked, Dessler never bothered to check whether it
was true, although an hour reading his source and its source would have found
the first error (60 cm vs 80 cm) and comparing Titus and Richman’s Figure 4
with a population density map of Florida, findable on Wikipedia, would have
strongly suggested that their numbers were much too high. I consider that the
most likely explanation.
It is also the most interesting because it helps answer the question of how
it is possible for an orthodoxy, a scientific claim supported by most
professionals in the field, to be wrong. Dessler made his claim about Florida
in the first edition of his book more than ten years ago. The book was widely
used as a textbook. Either nobody in the field bothered to check the claim or
those who discovered it was false never told Dessler or Dessler was told,
ignored the information, and continued to make the false claim in later
editions. So far as I can tell those are the only alternatives.
The way science is supposed to work is that individual scientists try to
make sure what they publish is true, some make mistakes, a few may commit
deliberate frauds, but both mistakes and frauds are controlled by the
willingness of others in the field to spot errors and correct them. That does
not work if the attitude of people in the field is that there is no need to
check claims that support a conclusion they agree with.
When I pointed out the problem to Dessler and, in the ensuing exchange,
pointed him at my analysis of a different false claim (the much repeated 97%
claim by John Cook discussed in the previous chapter), his response was
disinterest. He believed the conclusions being argued for, his and Cook’s, were
true; that was what mattered. In later correspondence he insisted that he
believed scientists should tell the truth, that when they didn’t it should be
pointed out, but that that he had never seen any examples of that being
necessary. Given his response to my offering him evidence of one case of error
(his) and one of deliberate fraud (Cook’s), that is not surprising.
What conclusion is true is what matters — the problem is how to find out.
That is difficult in a field where researchers are not concerned with whether
what they or others write is true as long as it leads to the right conclusion.
If everyone is doing that, none of them can trust his belief about what
conclusion is right since each is relying on the others for much of the
evidence on which the conclusion depends.
That is why, in the climate context as in others, I do not find “all the
experts agree” a compelling argument.
One issue in evaluating the effect of global warming is the tradeoff between
more deaths from heat and fewer from cold. Dessler writes in Chapter 1:
In fact, heat-related mortality is the leading cause of weather related
death in the United States, killing many more people than cold temperatures do.
He cites no source for the claim and as best I can tell it is not true.
According to a published article
by four authors from the CDC, cold kills about twice as many people in the
U.S. as heat. That is supported by the pattern of mortality over the year.
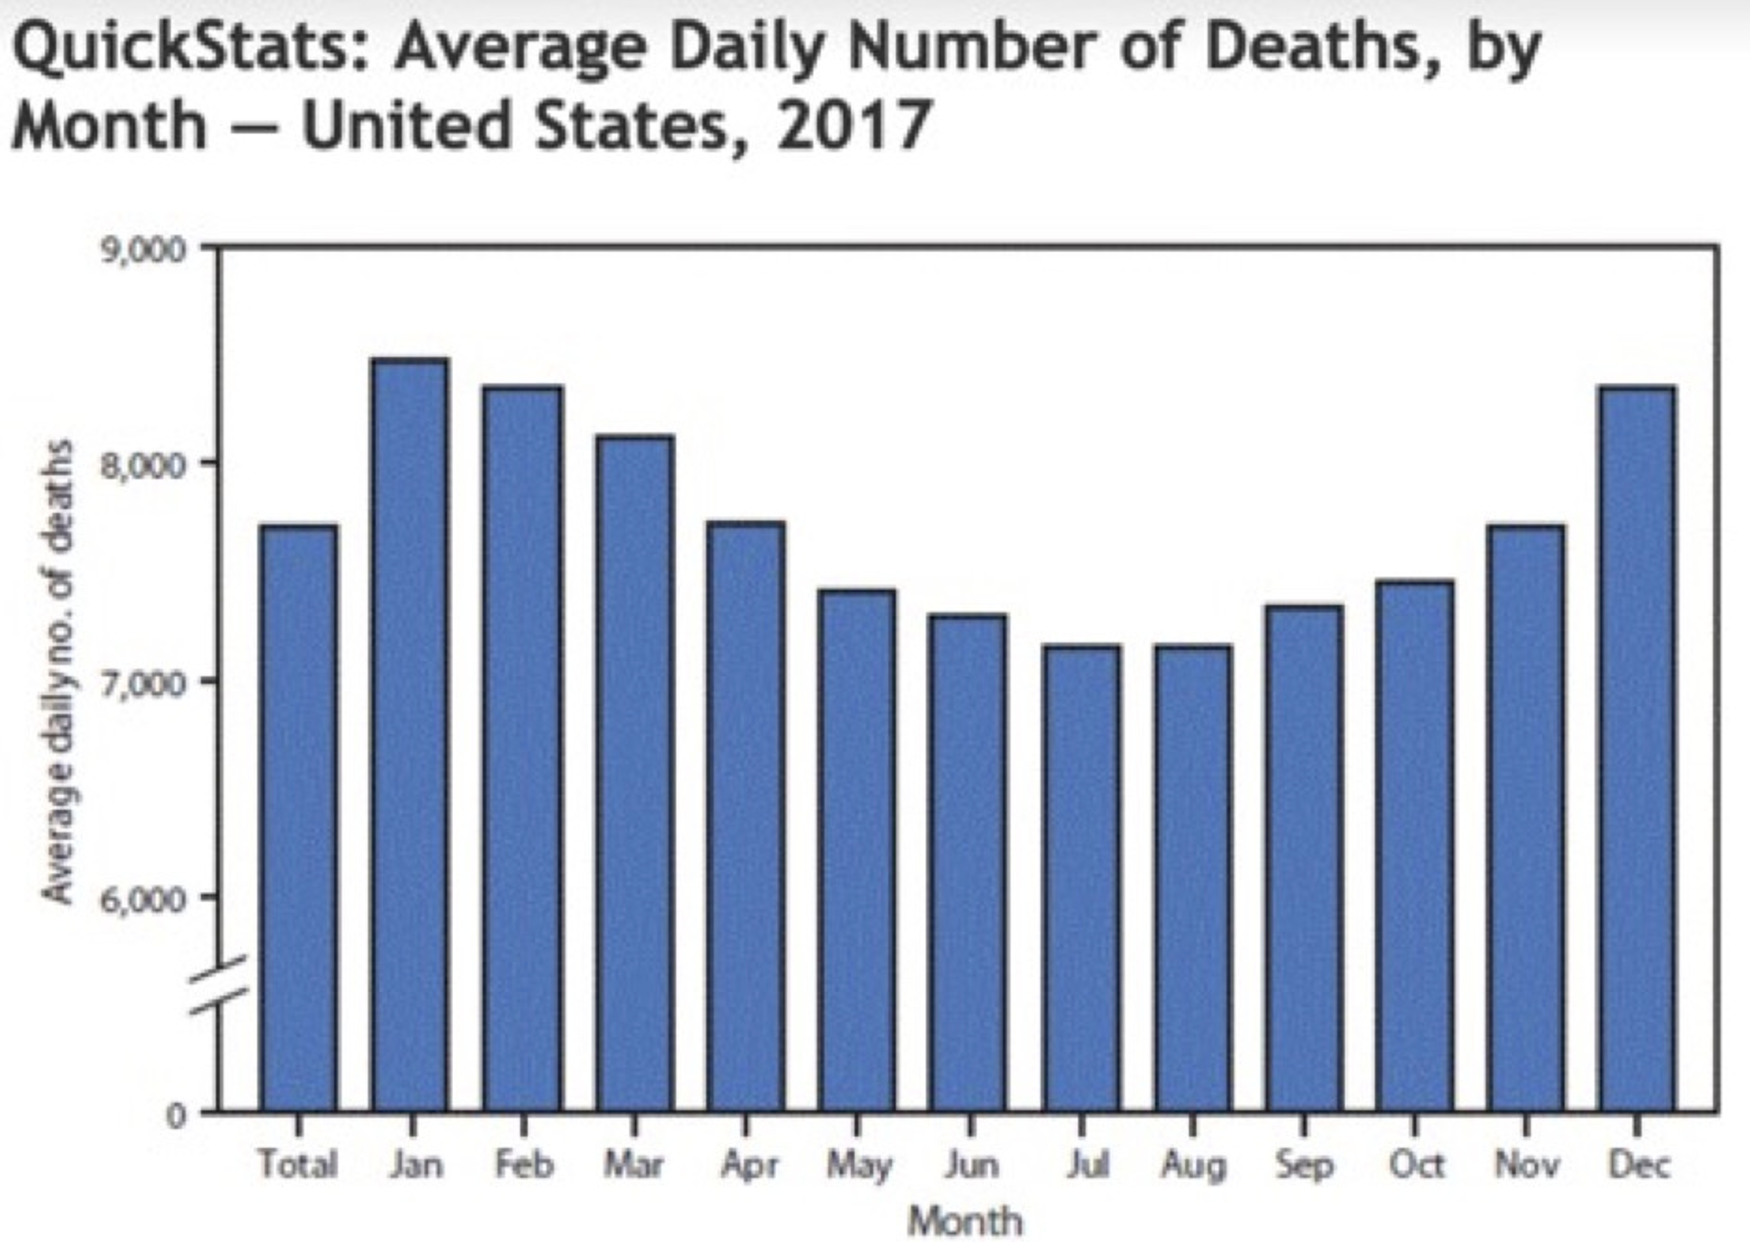
The fact that Dessler could confidently assert a relevant
fact that is at least debatable and probably false in a book that has been in
print for more than a decade, apparently with nobody ever pointing out the
problem, is again evidence that the climate field lacks mechanisms for active
error correction, making it possible for false claims to become accepted facts
of the field.
Dessler’s dismissal of the issue of reduced deaths from cold is one example,
but not the only one, of the most serious thing wrong with the book. In order
to evaluate the consequences of climate change one has to look at both positive
and negative effects. Chapter 9 of Dessler’s book, which deals with
consequences of climate change, does not mention a single positive consequence.
Here is a list of facts a student will not learn from this book:
1. Many more people die from cold than from heat, about fifteen times as
many globally according to an old article
in Lancet. That suggests that raising global temperatures might be
expected to reduce, not increase, total temperature-related deaths.
2. Warming due to the greenhouse effect tends to be greater in colder places
and colder seasons, the former obvious in IPCC maps of projected temperature
change such as that shown below.
Temperature increase is usually a good thing when it is cold, a bad thing when
it is hot, so the pattern is biased in our favor, which strengthens the
conclusion from point 1.
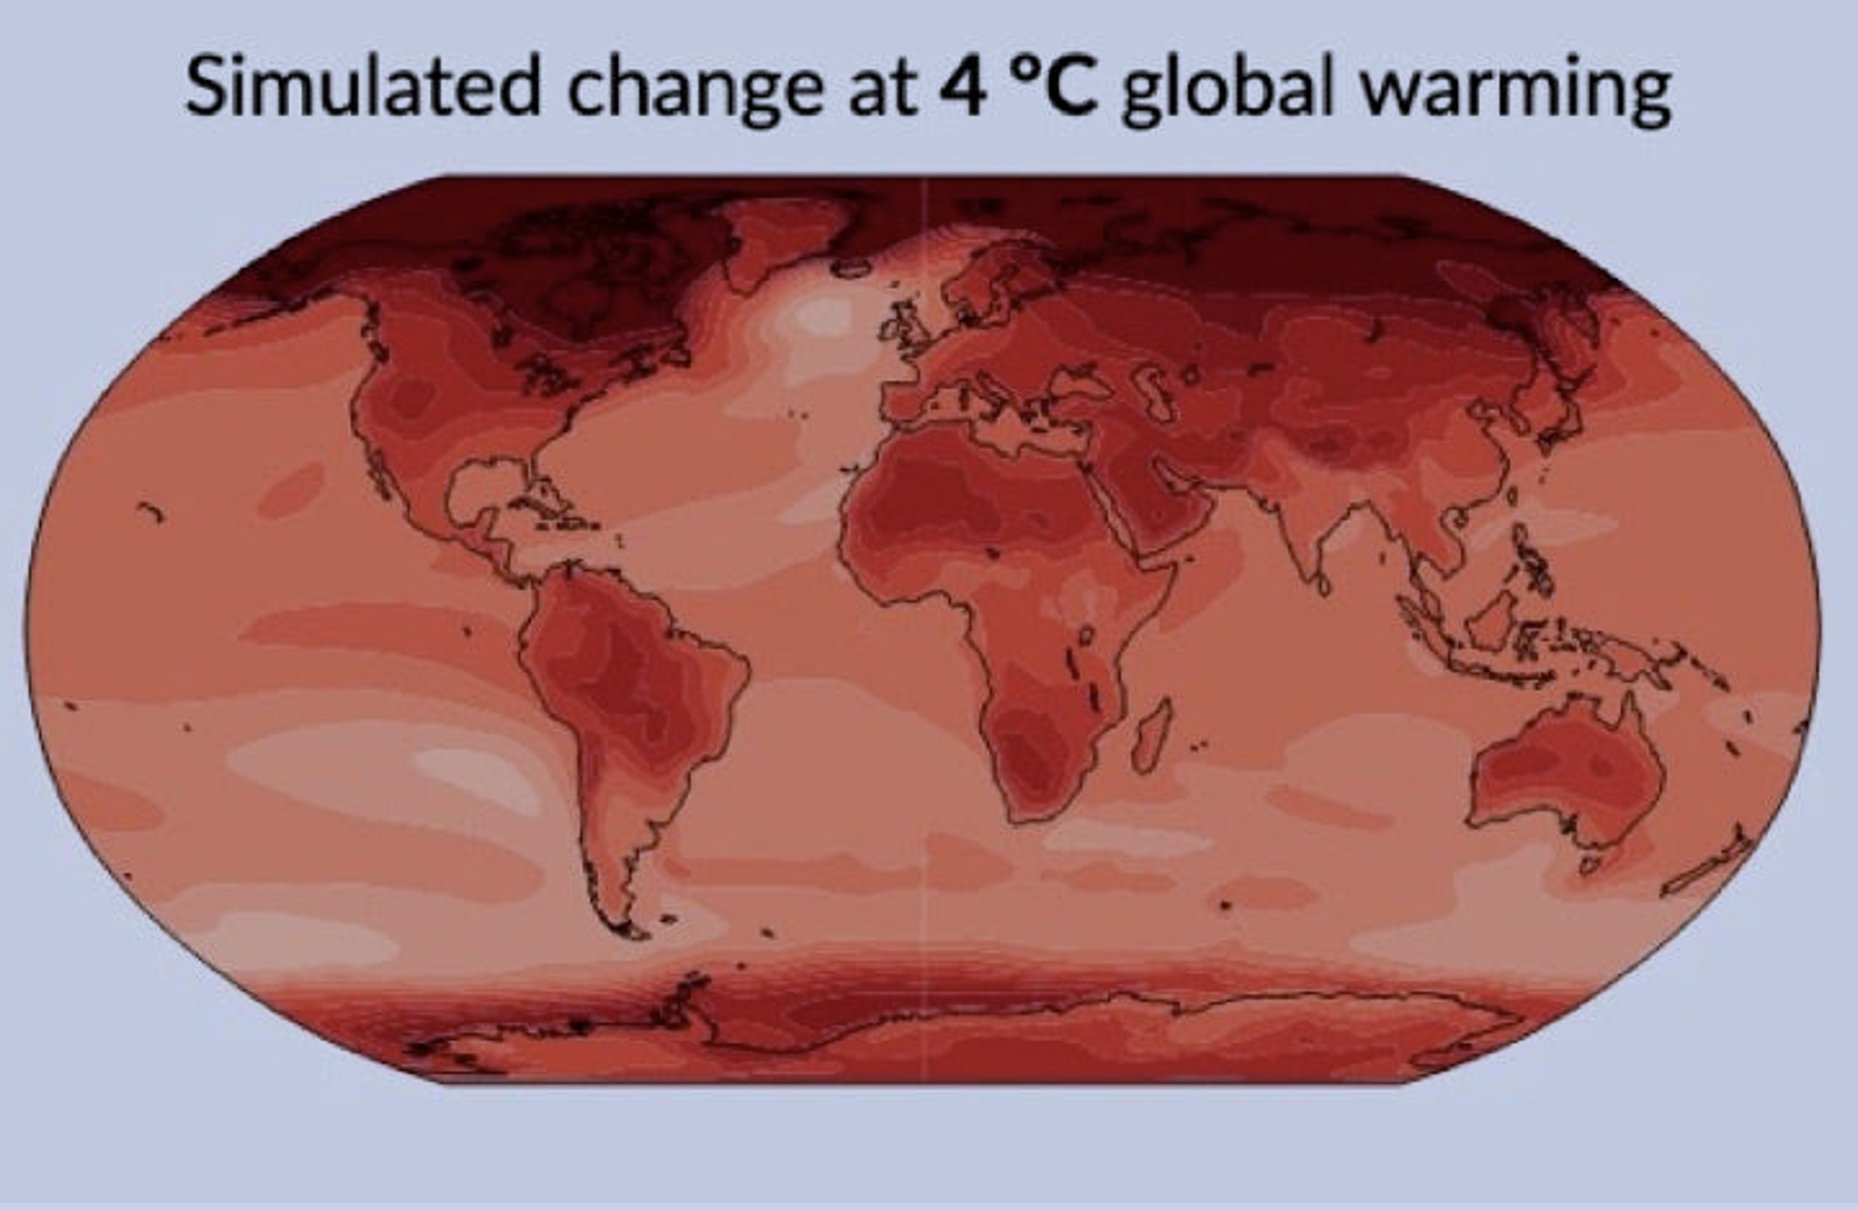
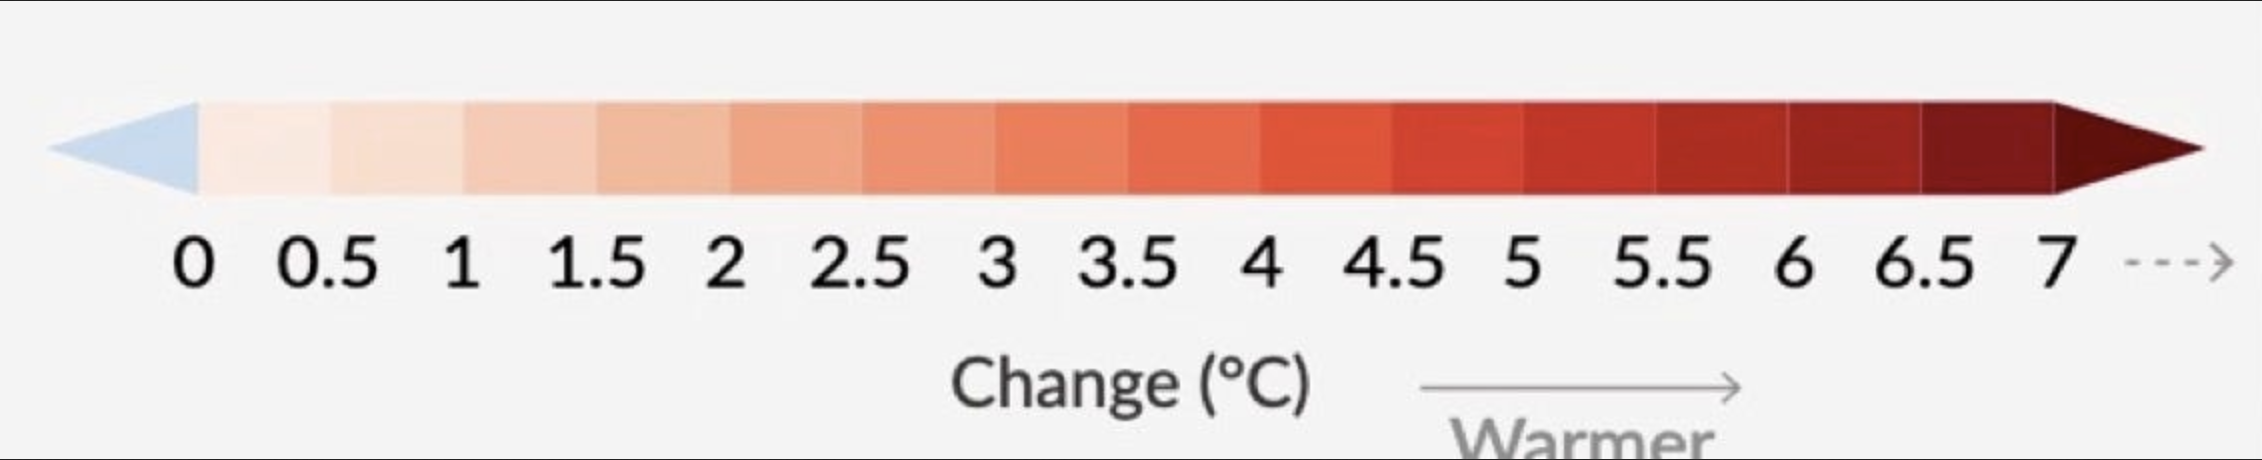
3. CO2 is an input to photosynthesis, so
increasing its concentration in the atmosphere increases plant growth and
yield. Doubling CO2 concentration, about what the IPCC projects for
the end of this century, substantially increases the yield of most crops.
That effect is well established experimentally and depends on only the first
step, increased CO2 concentration, in the causal chain that leads to
climate change. Increased CO2 concentration also reduces the need of
plants for water, since they do not have to pass as much air through their
leaves in order to get the carbon they need for growth.
4. Human land use at present is limited almost entirely by cold, not heat —
the equator is populated, the polar regions are not. As global temperatures
increase, temperature contours in the arctic shift north, increasing the amount
of land warm enough for human use. Land that was previously too cold for human
use is now warm enough, even if barely, land further south that was barely warm
enough is now warmer. It is not a small effect; in Chapter 4 I estimate that
the net effect of three degrees of additional warming is to increase usable
land by about the area of the U.S.
What about land lost through making it too warm for habitability? Comparing
temperature maps, both average and maximum, to a population density map, there
is no obvious pattern — some of the hottest regions are densely populated.
It follows that a student who has learned about climate change from this
book will end up with a badly distorted view of its effects. If the book
reflects the beliefs of its author, as I think likely from corresponding with
him, it follows that an active professional in the field can have a badly
distorted view of the effects of climate change, from which it follows that the
views of professionals in the field are not a reliable guide to what is true.
My disagreement with the current orthodoxy is not over a simple yes or no
fact, such as whether the average global temperature is rising, but over the
sum of a large number of uncertain costs and benefits. Setting a value to each
of them is a judgement call. If you are confident that the sum is negative it
is pretty easy to make high estimates for costs, low estimates for benefits,
and perhaps miss a few of the benefits because you are not looking for them.
My conclusion, that the net effect might be positive, is less heretical than
most people believe. The next chapter deals with Rennert et. al. 2022, a Nature
article on the cost of carbon which, I argue, badly exaggerated the costs it
looked at. Figure 2 of the article shows their calculation of the probability
distribution for the cost of carbon. Its left tail is below 0, meaning that
their calculations show a (small) probability that putting CO2 in
the air might make us better off
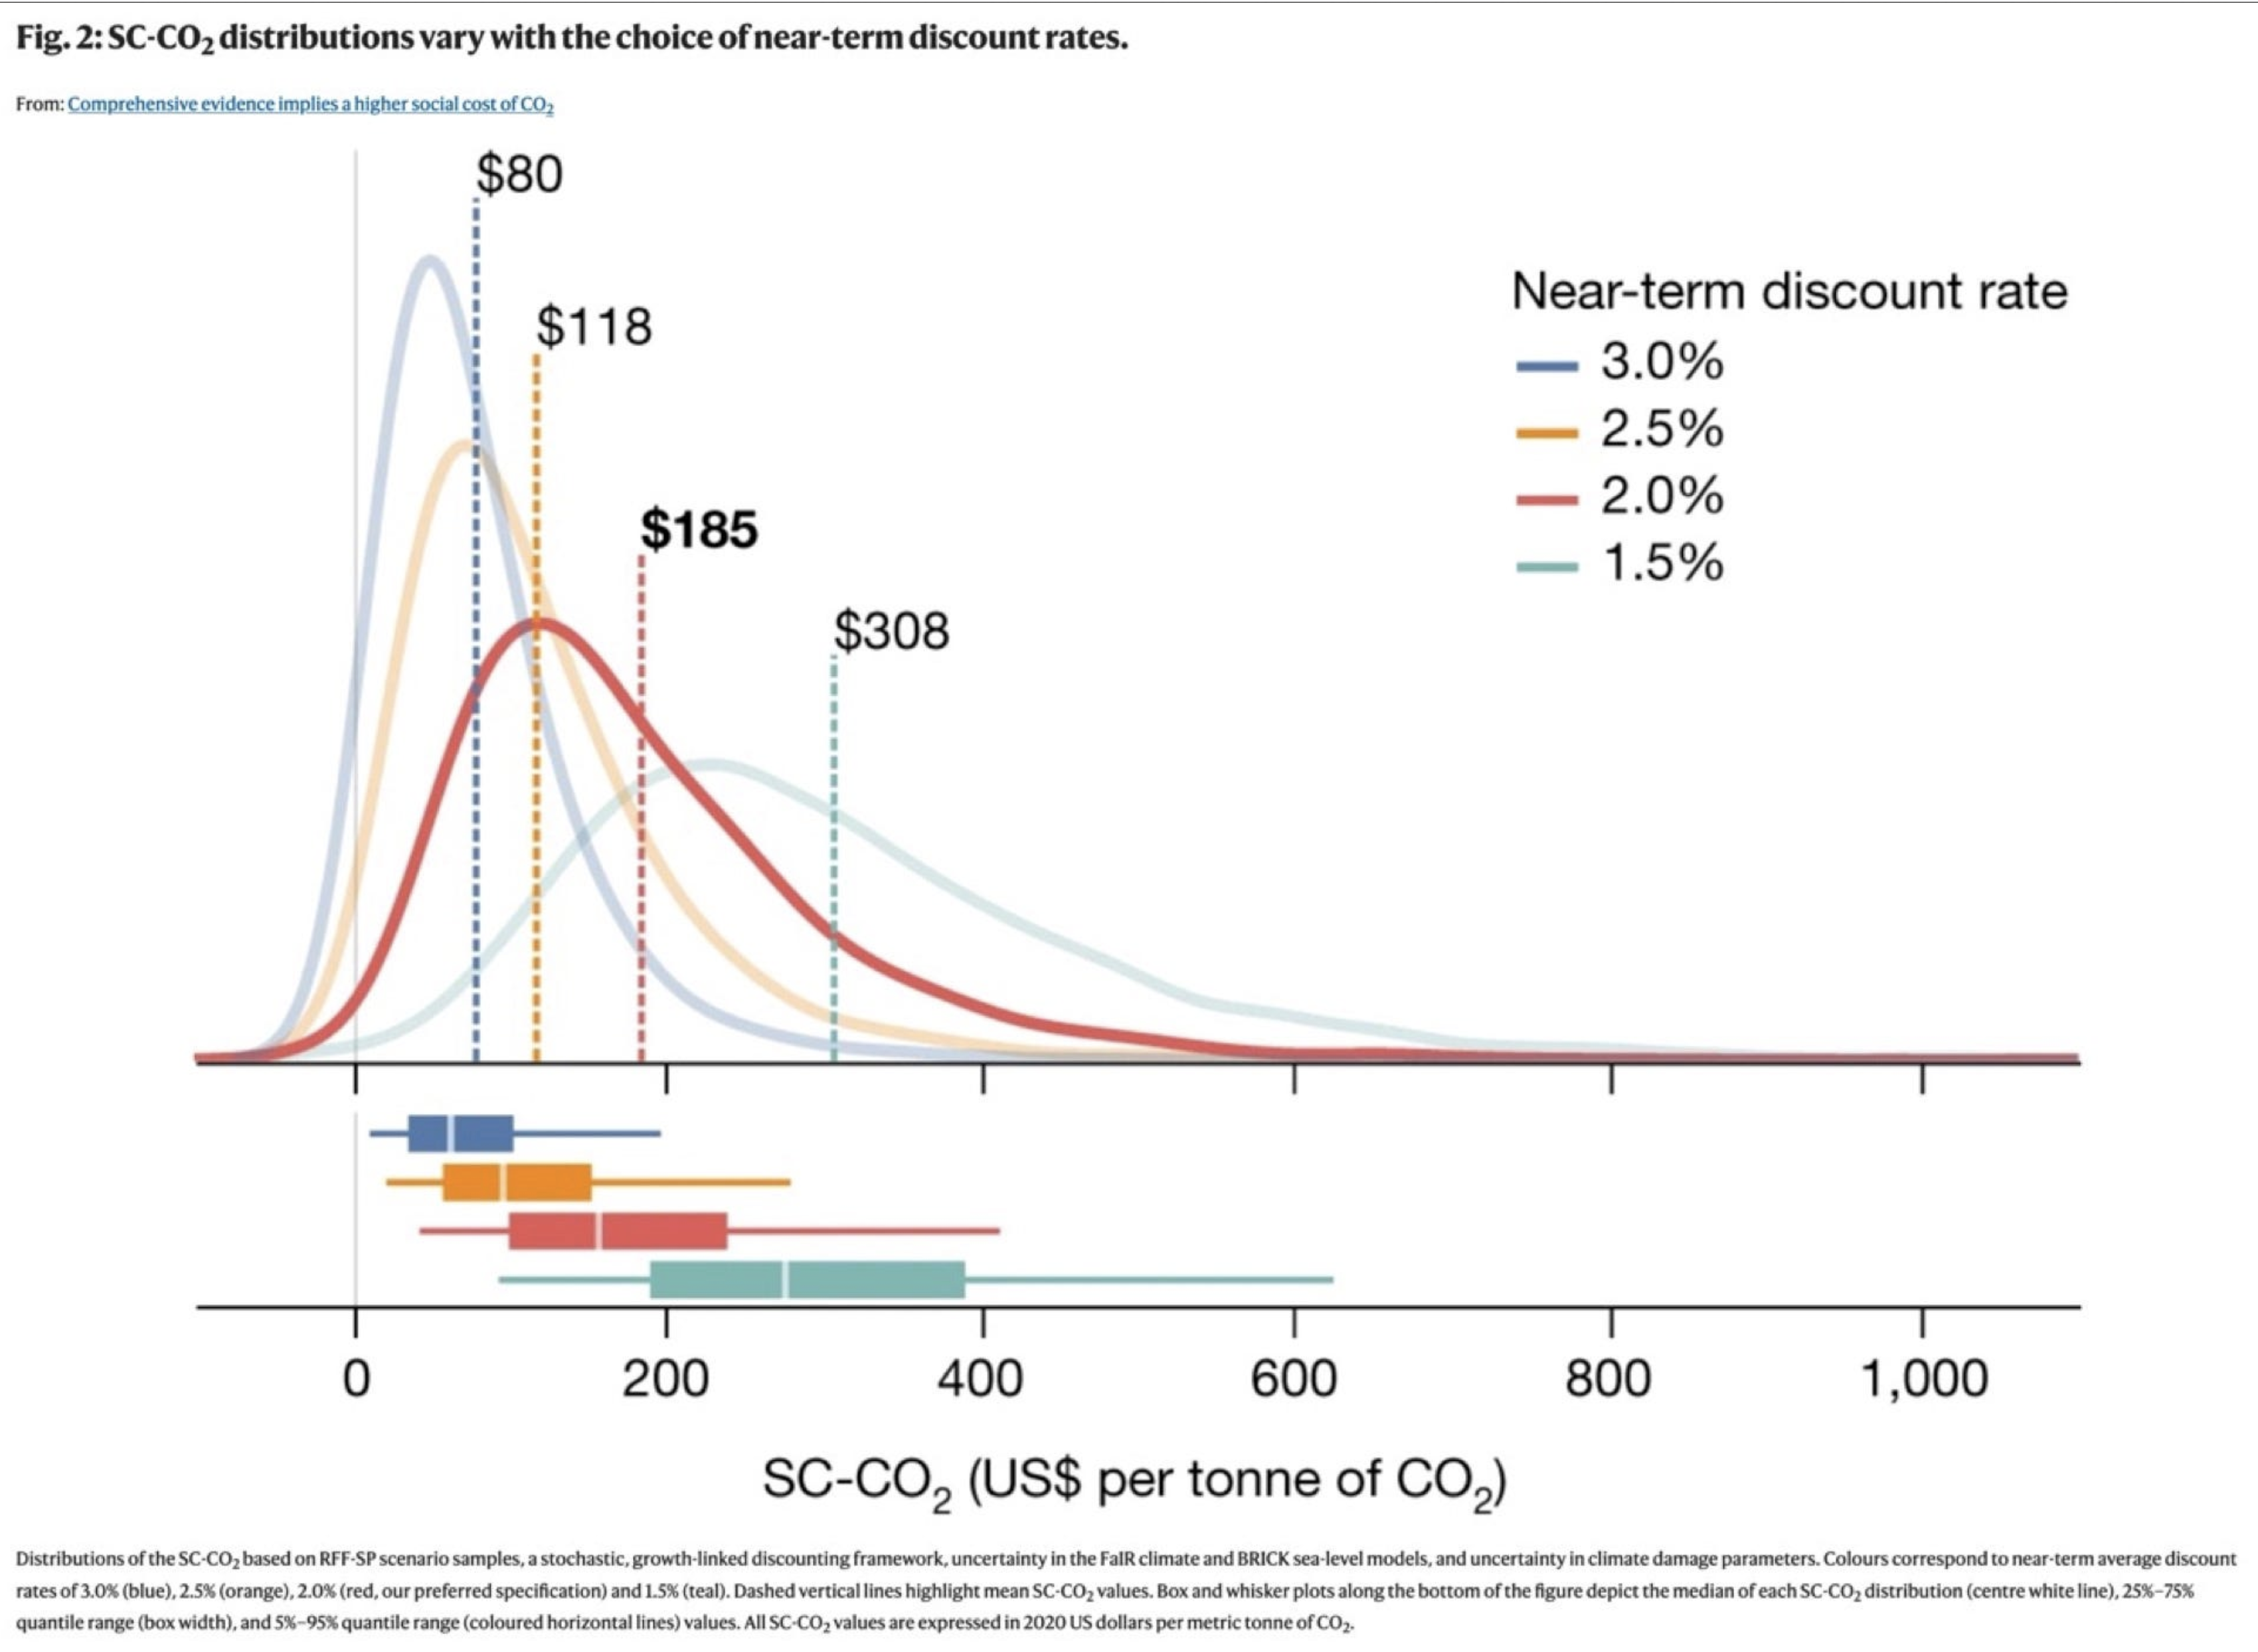
A recent Nature article, Rennert et al. 2022,
estimates the social cost of CO2 summed through 2300. The authors
find a total cost of $185 per ton of CO2, more than three times the
value of $51 used at the time in U.S. regulatory decisions. $90 of that is due
to increased mortality from higher temperatures, $84 to reduced agricultural
output, $2 to sea level rise and $9 to energy costs for residential and
commercial buildings.
The mortality calculation in Rennert is based on regional figures for
increased mortality per degree of temperature rise from Cromar et al. 2022.
Temperature-related mortality depends, among other things, on income, since
richer people can afford air conditioning and better insulated homes and have
less need to go out in unfavorable weather. The economic model in Rennert
implies per capita GNP roughly tripling by 2100, increasing about eleven-fold
by 2300,
but since Cromar does not include income in the relation between temperature
and mortality Rennert ignores the effect of that increase on
temperature-related mortality. Socioeconomic conditions are mentioned in Cromar
as a factor to be considered in future work but the implicit assumption of Rennert
is that, despite the large projected increase of income, the relation between
temperature and mortality will remain at the level of the recent past.
The article estimates the effect of increases in average temperature without
specifying the distribution over the year. An increase of 2°C in winter and 0°C
in summer would have a very different effect on mortality than an increase of
0°C in winter and 2°C in summer. Increases in temperature due to anthropogenic
climate change, as projected in the IPCC reports, are greater in winter than in
summer, so reduce mortality from cold more and increase mortality from heat
less than a uniform increase with the same average. The data in the articles
used by Cromar to deduce temperature-related mortality are from temperature
variation little of which is due to climate change so have no reason to
reproduce that pattern.
Carleton et al. 2022, a
more recent and more sophisticated calculation of the contribution to the
Social Cost of Carbon from temperature-related mortality, uses the same time
period and discount rate as Rennert but takes account of the effect on
mortality of both income and the temperature distribution. It found a value of
$36.6 for a high emissions scenario (RCP 8.5) and $17.1 for a moderate
emissions scenario (RCP 4.5). The latter is much closer than the former to the
assumptions in Rennert.
Temperature-related mortality depends on medical, heating, cooling, and
insulating technologies. We do not know how much those technologies will
improve over the next three centuries but that there will be no change is not a
plausible assumption. Yet that is the assumption implicit in Rennert, which
applies the increase in temperature-related mortality per degree of warming
calculated in Cromar from past data to project the increase from now to 2300.
Changes in mortality over recent history suggest that the effect they are
ignoring would be large.
Two examples:
Sidney
et al. find an annual decline in cardiovascular mortality in the United
States from 2000 to 2011 of 3.79%. Continued for the rest of the century that
would reduce cardiovascular disease, one of the sources of temperature-related
mortality, to about one twentieth of its present value by 2100.
Lay
et al., calculating temperature-related mortality rates first with 1973-82
data and then with 2003-13 data, found that the predicted increase in
temperature-related mortality in the U.S. for a 2°C increase fell by more than
97%, for a 6°C increase by 84%, due to changes in mortality rates over thirty
years.
Rennert projects mortality rates on the assumption that the relation between
temperature and mortality will remain constant for almost three hundred years.
A fourth factor ignored in Cromar is adaptation by migration. Currently,
280,000,000 people, about 3.5% of the world population, live in a different
country than they were born in. If some parts of the world become less
attractive due to climate change and some more, populations can be expected to
shift in response, reducing temperature-related mortality.
In summary, I found four problems with the use in Rennert of mortality
calculation from Cromar:
neglecting the effect of income on temperature-related mortality, ignoring the
pattern of temperature change implied by greenhouse warming, neglecting the
effect of technological change, ignoring adaptation by migration. The first two
can be corrected by substituting the result in Carleton for that in Cromar,
reducing the SCC due to temperature-related mortality from $90/ton to something
between $17.1/ton and $36.6/ton. Correcting the third and fourth should further
reduce it by a large but unknown amount.
Rennert bases its estimate of the effect of climate change on agriculture on
Moore et al. 2017.
I find three problems with its calculations.
One way of adapting agriculture to a changed environment is by modifying
crop varieties. Biotech is a rapidly progressing field so we can expect our
ability to modify crop varieties to improve over time. A more primitive form of
biotech, selective breeding, adapted maize to the cooler climate of North
America. As our biotechnology improves we should be able to do the same thing
with other crops in the other direction in decades instead of millennia.
Research in adapting wheat to hotter temperatures is currently ongoing.
“The yield–temperature response functions used in this paper
are derived from a database of studies estimating the climate change impact on
yield compiled for the IPCC 5th Assessment Report, also described in a
meta-analysis by Challinor et al.” (Moore)
That quote makes puzzling the striking difference between the two papers. Figure 1 in
Challinor shows the effect of temperature on yield for wheat, maize, and rice
both with and without adaptation, in temperate and tropical regions. Without
adaptation yield falls in all cases. With adaptation, yield rises with
temperature for wheat and maize in temperate regions, rice definitely in
tropical and perhaps also in temperate regions, falls for wheat above 2°C and
maize throughout the temperature range shown, in tropical regions. Since
most wheat is grown in temperate regions, most rice in tropical regions, and a
majority of maize in temperate regions, that should result in an increase, not
a decrease, in yield with temperature.
Increases in CO2 concentration in the atmosphere increase the
yield of C3 crops and reduce water requirements for both C3 and C4 crops. Moore
uses a figure of 11.5% increase in C3 yield with a doubling of CO2 concentration,
writing “This is very close to estimates from experimental field studies for C3
crops” and footnoting the claim to Long
et al. 2006. Long, however, found increases of 12%, 13%, and 14%
(rice, wheat, and soybeans) from an increase to 550 ppm from the ambient
concentration, which implies an increase of about 26.7% for a doubling.
Kimball 2016, a survey
of FACE (Free-air CO2
Enrichment) studies of which Long is one, found that “Yields of C3
grain crops were increased on average about 19%” by increasing CO2 from 353 ppm
to 550,” which implies a 39% increase for a doubling.
Taylor
and Schlenker 2022 used random variation in CO2 concentration
observed by NASA’s Orbiting Carbon Observatory-2 satellite, combined with
county level crop yield data, to directly observe the effect of varying CO2
concentration on crop yields in actual agricultural practice. They found
that a 1 ppm increase in CO2 equates to a 0.4%, 0.6%, 1% yield
increase
for corn, soybeans, and wheat respectively. Their article includes a discussion
of reasons why the FACE studies may have substantially underestimated the
effect.
Moore’s modeling produces an anomalously low value for CO2
fertilization of C3 crops — less than half the value in the source they cite, less
than a third the value found in the most recent survey of FACE results, lower
still relative to the results in Taylor and Schlenker 2022. That is at least
part of the reason that they get a much more negative result for the social
cost of carbon than earlier studies that used earlier and higher estimates from
enclosed rather than free air studies — FUND, which found a net benefit, or
AgMIP, which found a cost but a substantially smaller one.
Replacing Moore’s 11.5% by Kimball’s 39% would substantially reduce the
contribution of the effect of climate change on agriculture to the cost of
carbon. McKitrick’s reanalysis of Moore’s data set with missing
variables where possible filled in finds a zero or positive effect of climate
change on crop yield.
Correcting the neglect of technological change and using a more realistic
value for CO2 fertilization would reduce Moore’s estimate
substantially, might make the net effect of climate change on agriculture
positive.
Over the past two centuries, technological change has replaced sailing ships
with jet planes for long distance transportation. Over the past century,
medicine has progressed from a point where almost no contagious diseases were
curable to one where almost all are. Over the past fifty years, computer
technology has progressed to the point where the typical member of a developed
society carries in his pocket a computer more powerful than any that existed
fifty years ago. There is no reason to believe that the process has stopped and
no way of predicting its effects on the world beyond the very short term. As I
wrote in a book published seventeen years ago:
… with a few exceptions, I have limited my discussion of the
future to the next thirty years or so. That is roughly the point at which both
AI and nanotech begin to matter. It is also long enough to permit technologies
that have not yet attracted my attention to start to play an important role.
Beyond that my crystal ball, badly blurred at best, becomes useless; the
further future dissolves into mist. (Friedman 2008)
Rennert sums costs over the next three centuries, with about two-thirds of
the total coming after 2100.
Their solution to the problem of predicting technological change over that
period is, with the exception of their estimates of CO2 production
and energy costs, to ignore it, implicitly assume technological stasis. That is
the wrong solution but any projection of technological change that far into the
future would be science fiction not science.
What they claim to do cannot be done.
William Nordhaus, an economist who has been researching the implications of
climate change for many years and in 2018 received a Nobel prize for his work,
published an article
in The New York Review of Books in 2012 titled “Why the Global Warming
Skeptics Are Wrong.” It was written as a response to an opinion
piece in the Wall Street Journal titled “No Need to Panic About
Global Warming.” He wrote, quoting the piece:
The first claim is that the planet is not warming. More
precisely, “Perhaps the most inconvenient fact is the lack of global warming
for well over 10 years now.”
And in response offered a graph of global temperature:
We do not need any complicated statistical analysis to see
that temperatures are rising, and furthermore that they are higher in the last
decade than they were in earlier decades.
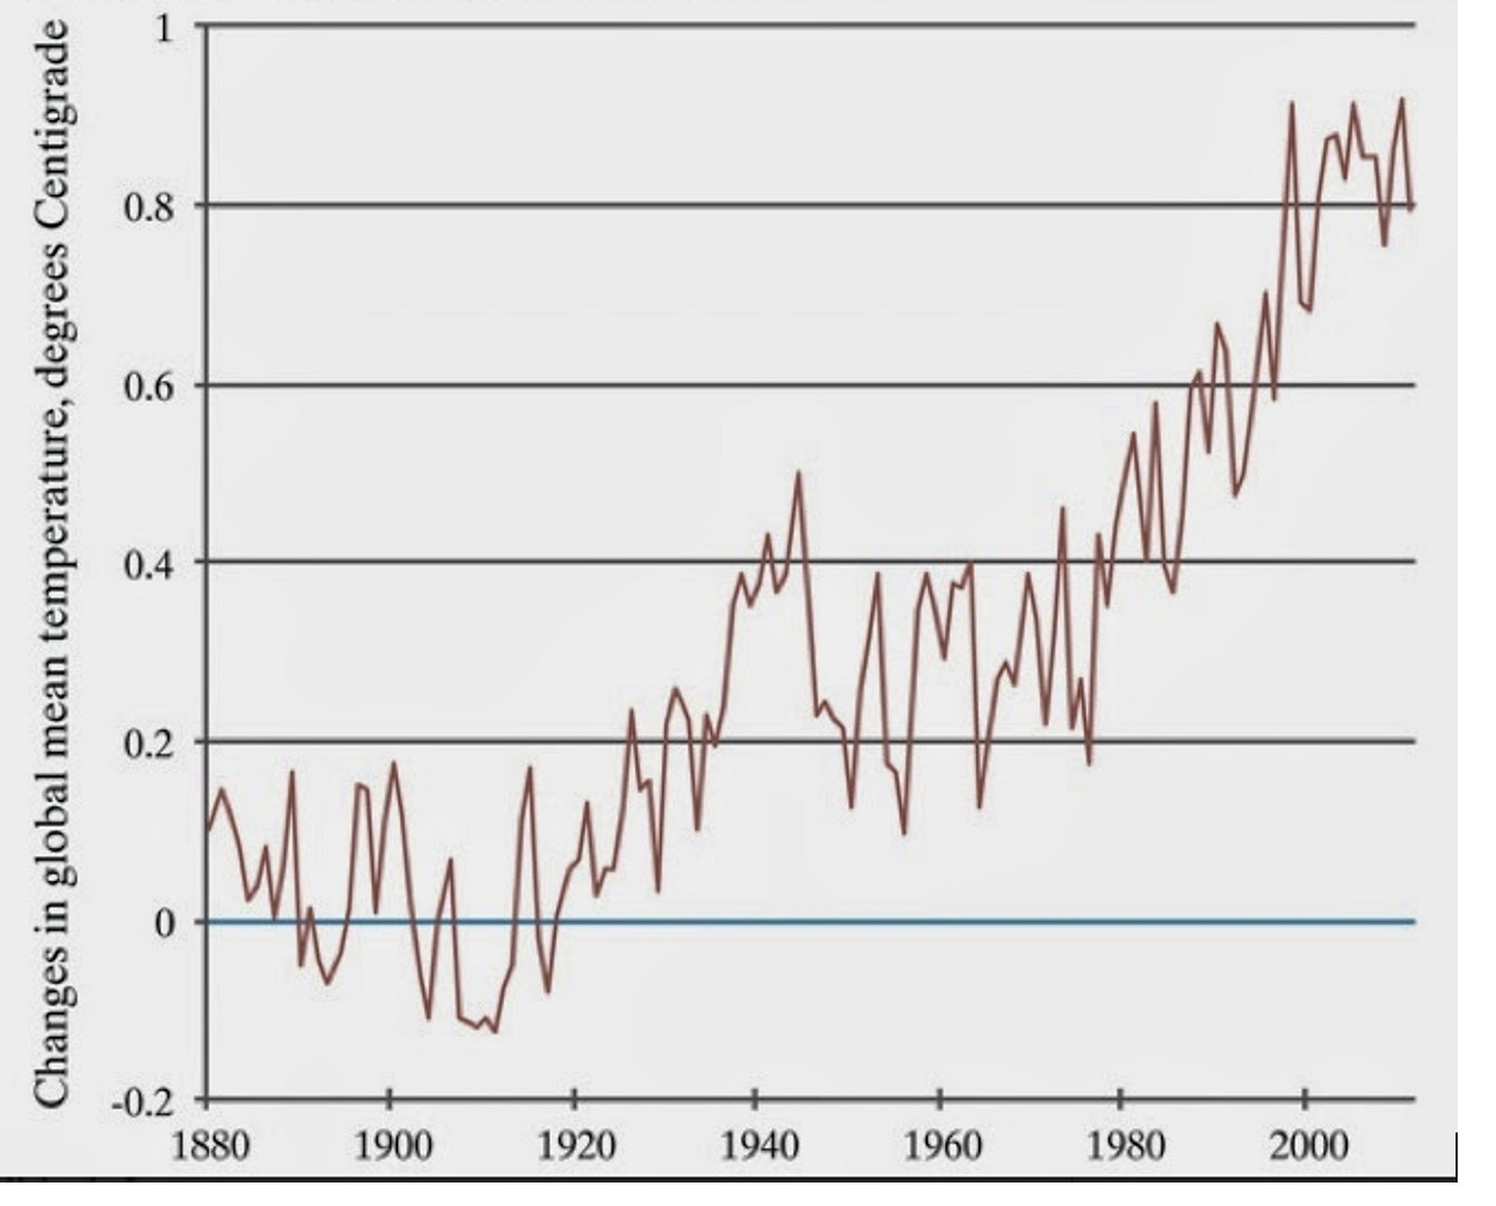
We do not need any complicated analysis to see that
temperatures have risen over the period 1900 to the present but the piece he is
attacking did not say that they hadn't. It said that they had not been rising
for more than ten years which, so far as one can tell from the graph, was
true. Among those critical of AGW there are at least a few who deny that
warming has occurred at all but Nordhaus limited himself to the claims in a
particular article and that was not one of them. The observation that temperatures
are higher than in earlier decades implies that they rose in earlier decades,
not that they are rising in the current decade. An economist should be able to
distinguish between a level and a rate of change.
Responding to a criticism of the climate models Nordhaus wrote that
"the projections of climate models are consistent with recorded
temperature trends over recent decades only if human impacts are
included." That is a statement about the ability of models to fit past
data. The distinction between the ability of a theory to fit past data and its
ability to predict data not used in building it is another thing one would
expect an economist to be familiar with. As of
2012 all of the first four IPCC reports did a poorer job of predicting
temperature than a simple linear fit to the data from 1965, when warming
restarted after the mid-century pause, to the date of the report. That does not
show that the models are wrong — they are doing better now (Chapter 15) — but
it was, at the time Nordhaus wrote, weak evidence that they were right.
Nordhaus next responded to the article's attack on the description of CO2
as a pollutant.
In economics, a pollutant is a form of negative
externality—that is, a byproduct of economic activity that causes damages to
innocent bystanders. The question here is whether emissions of CO2
and other greenhouse gases will cause net damages, now and in the future. This
question has been studied extensively. The most recent thorough survey by the
leading scholar in this field, Richard Tol, finds a wide range of damages,
particularly if warming is greater than 2 degrees Centigrade. Major
areas of concern are sea-level rise, more intense hurricanes, losses of species
and ecosystems, acidification of the oceans, as well as threats to the natural
and cultural heritage of the planet.
The critical issue is the sign of net damages. That CO2 increase
causes damages is not sufficient to make it a pollutant in the economic sense
since it also produces benefits. Neither Nordhaus, Tol, nor I knows whether the
net externality is positive or negative, since it depends on unknown future
events. In earlier chapters I discussed positive effects that might outweigh
the negative at the levels of temperature increase suggested by the IPCC
models, in which case the net externality would be a benefit not a cost. Tol
himself found that the early stages of warming produced net benefits, the later
stages net costs.
Nordhaus’s final and most important point was based on his own research.
My research shows that there are indeed substantial net
benefits from acting now rather than waiting fifty years. A look at Table 5-1
in my study A Question of Balance (2008) shows that the cost of
waiting fifty years to begin reducing CO2 emissions is $2.3 trillion in 2005
prices. If we bring that number to today’s economy and prices, the loss from
waiting is $4.1 trillion [5.8 trillion at 2025 prices]. Wars have been started
over smaller sums.
What he does not mention is that his $4.1 trillion is a cost spread over the
entire globe and an extended period of time. If he is summing over the rest of
the century his $4.1 trillion total comes to about $48 billion a year but in A
Question of Balance he appears to be summing over the next 250 years,
which would reduce the annual cost to $16 billion. Current world GNP is about $110
trillion/year. The annual cost of waiting, on Nordhaus's numbers, is about one
twentieth of one percent of world GNP assuming the shorter period, one fiftieth
assuming the longer.
I suggest a simple experiment. Let Nordhaus write a piece explicitly arguing
that the annual net cost of waiting fifty years to do anything about climate
change is about .06% of world GNP and see whether it is more popular with the
supporters or the critics of his position. I predict that at least one
supporter will accuse him of having sold out to big oil.
Was his conclusion that we ought to have a carbon tax correct? In a world of
certainty run by benevolent philosopher kings the fact that a policy has even a
relatively modest benefit would be a good argument for it but we do not live in
such a world. Policies aimed at reducing warming will be designed not by
William Nordhaus but by political actors subject to political incentives. For a
sample of what that is likely to produce, I suggest looking at the Waxman-Markey
bill, the cap and trade bill that passed the House in 2009 but did not make
it through the Senate. It was not written by Nordhaus. The further the policies
are from the optimal the lower their net benefits. Nordhaus himself recognized
that in the discussion in his book of alternatives to his optimal policy,
including one proposed by Al Gore, and in his observation that the cost of
permits in the EU trading system was almost four times his estimate of the
optimal carbon price. If so, the externality created by the policy is larger
than the externality it corrects.
One chapter of A Question of Balance is a discussion of the
unavoidably large uncertainty in his calculations.
It never seems to have occurred to him that, since uncertainty decreases over
time as more information comes in, the existence of uncertainty is an argument
for delay, a stronger argument the greater the uncertainty. Fifty years from
now it may turn out that warming has been much less than the IPCC projected due
to technological changes that lower the cost of solar or nuclear power below
that of power from fossil fuels, sharply reducing CO2 output. It may
turn out that warming has followed the projected path but costs have not, that
the projected increases in droughts and the strength of hurricanes have not
happened. It may turn out that benefits from milder winters, CO2
fertilization of agriculture, expansion northward of habitable land area, turn
out to be larger than in Nordhaus's calculations. It may turn out that progress
in other technologies has provided us with easy and inexpensive ways of
modifying either the CO2 content of the atmosphere or global
temperature. The future is very much too uncertain to have confidence in
estimates of what will be happening fifty years from now.
If we follow Nordhaus's current advice and tax carbon now in order to slow
future warming it may turn out that doing so was unnecessary or even
counterproductive. We may be bearing costs in order to make ourselves poorer.
I conclude, on the basis of Nordhaus's report of his calculations, that he
has his conclusion backwards. The sensible strategy is to take no actions whose
justification depends on the belief that increased CO2 produces
large net costs until we have better reason than we now do to believe it.
Not judged by his rhetoric; the article I have been discussing was titled
“Why the Global Warming Skeptics Are Wrong.” But if you look not at his words
but his numbers, the answer becomes less clear; his estimate of the cost of
waiting fifty years to take any action against global warming implies that,
seen on the scale of a world economy, it is tiny. And in his book he writes:
the best guess in this book is that the economic damages from
climate change with no interventions will be on the order of 2.5 percent of
world output per year by the end of the twenty-first century (A Question of
Balance, p. 6)
He offers that as an argument in favor of a carbon tax. Compared to the
usual lurid accounts of impending catastrophe it makes climate change look like
a wet firecracker.
I have interpreted
Nordhaus in the past as trying to bias the output of his work as far in the
orthodox direction as he can subject to not lying about his equations or what
they imply. An alternative interpretation is that he is doing his best to hold
down the wildly exaggerated response to climate change of the climate
community. If he says that climate change is not a problem nobody will listen
to him. But if he tweaks his work just enough to support doing something about
it but not a very drastic something, …
Nordhaus attacked the claim in the Wall Street Journal piece that
climate scientists are under pressure not to take positions skeptical of global
warming, making fun of the comparison to the enforcement of orthodoxy under
Stalin. While the piece did contain that comparison, its actual argument was
that dissenting scientists "are afraid to speak up for fear of not being
promoted—or worse… ." Pointing out that "No skeptics have been
arrested or banished to gulags or the modern equivalents of Siberia" did
not answer that. Nor did his observation that "the dissenting authors
are at the world’s greatest universities." Firing tenured professors is
difficult, failing to hire or to promote much easier. And while the scientists
who signed the WSJ piece were employed by major universities most of them were
not in climate science hence unaffected by whatever pressures, social or
professional, exist for climate scientists.
His conclusion was:
"I believe the opposite of what the sixteen claim to be
true: dissident voices and new theories are encouraged because they are
critical to sharpening our analysis."
The arguments he offers in support of that claim I find unpersuasive but
that does not imply that the claim itself is false. The piece he is criticizing
offered no evidence in favor of its claim in the opposite direction. Nordhaus
himself, however, provides some, not in words but in deeds.
The claim of the critics is summed up in the title of their article:
"No Need to Panic About Global Warming: There's no compelling scientific
argument for drastic action to 'decarbonize' the world's economy." The
claim of those on the other side is the opposite, that global warming poses a
severe threat to human welfare and drastic action is needed to slow it. Which
side of that argument does Nordhaus' own research support?
The answer is clear. He finds that the net cost of waiting fifty years
instead of taking the optimal actions now is $4.1 trillion dollars. Spread out
over the entire globe and an extended period of time that comes to a tiny
fraction of world GNP. Which position is that closer to, that there is a need
to panic and take drastic action or that there is not?
And yet, when Nordhaus publishes an article in a high-profile publication,
it is an attack on the critics not on those who, according to his own research,
vastly exaggerate the scale of the problem and the need for immediate, drastic
action.
A central idea of economics is revealed preference; we judge people by what
they do, not what they say.
Ted Nordhaus, William Nordhaus’s nephew, also active in the climate field, in
a post on why he no longer accepts the catastrophic version of the current
orthodoxy offers a
very different account of the incentives facing climate scientists:
The second reason is that there are strong social, political,
and professional incentives if you make a living doing left of center climate
and energy policy to get climate risk wrong. The capture of Democratic and
progressive politics by environmentalism over the last generation has been
close to total. There is little tolerance on the Left for any expression of
materialist politics that challenge foundational claims of the environmental
movement. Meanwhile the climate movement has effectively conflated consensus
science about the reality and anthropogenic origins of climate change with
catastrophist claims about climate risk for which there is no consensus
whatsoever.
Whether you are an academic researcher, a think tank policy
wonk, a program officer at an environmental or liberal philanthropy, or a
Democratic Congressional staffer, there is simply no benefit and plenty of
downside to questioning, much less challenging, the central notion that climate
change is an existential threat to the human future. It’s a good way to lose
friends or even your job. It won’t help you get your next job or your next
grant. And so everyone, mostly falls in line. Better to go along to get along.
Academics have three ways of gaining income and status in their profession.
One is by being hired by a university, preferably a top university, preferably
with tenure. A second is by publishing articles in journals, preferably top
journals. A third is by publishing original work that the rest of their
profession finds convincing. What are the implications for each of being a
dissident, someone who rejects the current orthodoxy in one's field?
Hiring and promotion decisions are made by senior faculty members. Senior
faculty members mostly subscribe to whatever is the current orthodoxy — that is
part of what it means for a view to be orthodoxy. From the standpoint of the
people deciding the dissident's fate he is someone who has rejected truth in
favor of error, not a job qualification. If sufficiently able he may overcome
that handicap by persuading them that he is brilliant, technically able,
unusually hard working. But it will not be easy.
Much the same applies to the second route to success. The articles he
submits will be reviewed by other people in his field. They too are likely to
subscribe to the orthodoxy he rejects. Here again, the situation is not
hopeless. If an article is sufficiently brilliant the reviewers may conclude
that it is worth publishing even if wrong. They may even be convinced that it
is right — but that is not the way to bet. Most of us are more open minded in
theory than in practice.
It is only with regard to the third route that being a dissident can be an
advantage. Work that supports what everyone else already believes may get you
hired and published but work that offers convincing arguments against the
accepted view and for an alternative attracts more attention, not all of it
hostile. It may make you the leader of a new school of thought within your
field. It may even win you a Nobel prize.
In order to achieve that sort of success, however, you have to get your work
published. That is easier if you are offering your arguments from the pulpit
provided by a tenured position at a top university. Those are conditions that
the dissident may have trouble satisfying.
I am not arguing that new views can never replace old—obviously they
sometimes do. But the situation as I have observed it is the opposite of the
rosy picture offered by Nordhaus. When Nordhaus writes that new theories are
encouraged because they are critical to sharpening our analysis he is
describing how the academic system should work not how it does work.
News stories claimed that a 2014 paper
by Lovejoy proved that the probability that the warming of the past century is
entirely due to natural causes is less than one percent. I find the conclusion
plausible enough but, so far as I can tell, there is no way that it can be
derived in the way Lovejoy is said to have derived it.
The first problem, the fault of the reporters not of Lovejoy himself, is the
misinterpretation of what the confidence result produced by classical
statistics means. If you analyze a body of data and reject the null hypothesis
at the .01 level that means that if the null hypothesis is true, the
probability that the evidence against it would be as strong as it is is less
than .01 — the probability of the evidence conditional on the null hypothesis.
That does not imply that the probability that the null hypothesis is true given
that the evidence against it is that strong is less than .01 — the probability
of the null hypothesis conditional on the evidence. The two sound similar but
are in fact entirely different.
My standard example is to imagine that you pull a coin out of your pocket,
toss it without inspecting it, and get heads twice. The null hypothesis is that
it is a fair coin, the alternative hypothesis that it is a double headed coin.
The chance of getting two heads if it is a fair coin is only .25. It does not
follow that, after getting two heads, you should conclude that the probability
is .75 that the coin is double headed.
The second problem is that, so far as I can tell, there is no way Lovejoy
could have calculated the probability that natural processes would produce 20th
century warming from the data he was using, which consisted of a reconstruction
of world temperature from 1500 to the present. The paper is sufficiently
complicated so that I may be misinterpreting it, but I think his procedure went
essentially as follows:
Assume that changes in global temperature prior to 1880 were due to random
natural causes. Use the data from 1500 to 1875 to estimate the probability
distribution of natural variation in global temperature. Given that
distribution, calculate the probability that natural variation would produce as
much warming from 1880 to 2008 as occurred. That probability is less than .01.
Hence reject at the .01 level the null hypothesis that warming from 1880 on was
entirely due to natural causes.
The problem with this procedure is that data from 1500 on can only give
information on random natural processes whose annual probability is high enough
so that their effect can be observed and their probability calculated within
that time span. Suppose there is some natural process capable of causing a
global temperature rise of one degree C in a century whose annual probability
is less than .001. The odds are greater than even that it will not occur even
once in Lovejoy's data, hence he has no way of estimating the probability that
such a process exists. The existence of such a process would provide an
explanation of 20th century warming that does not involve human action, so he
cannot estimate, from his data, how likely it is that natural processes would
have produced observed warming, which is what he is claiming to do. 20th
century warming would, in that case, be what Taleb refers to as a Black Swan event. If
one swan in a thousand is black, the observer looks at five hundred swans,
finds all of them white, and concludes, incorrectly, that the probability of a
black swan is zero.
How does Lovejoy solve that problem? If I correctly read the paper, the
answer is:
Stated succinctly, our statistical hypothesis on the natural
variability is that its extreme probabilities ... are bracketed by a modified
Gaussian...
In other words, he is assuming a shape for the probability distribution of
natural events that affect global climate. Given that assumed shape, he can use
data on the part of the distribution he does observe to deduce the part he does
not observe. But he has no way of testing the hypothesis, since it is in part a
hypothesis about a part of the curve for which he has no data.
If I am correctly reading the paper that means that Lovejoy has not only not
proved what reporters think he has, he has not proved what he thinks he has
either. A correct description of his result would be that the probability that
natural processes would produce observed warming, conditional on his
assumption about the shape of the probability distribution for natural
processes that affect global temperature, is less than .01.
One obvious question is whether this problem matters, whether, on the basis
of data other than what went into Lovejoy's paper, one can rule out the
possibility of natural events capable of causing rapid warming that occur too
infrequently for their probability to be deduced from the past five hundred
years of data. The answer is that we cannot. The figure below is temperature
data deduced
from a Greenland ice core. It shows periods of rapid warming, some much
more rapid than what we observed in the 20th century, occurring at intervals of
several thousand years. During one of them, "The temperature increased by
more than 10°C within 40 years." The temperature shown is local not global
— we do not have the sort of paleoclimate reconstructions that would be needed
to spot similar episodes on a global scale. But the fact that there are natural
sources of very rapid local warming with annual frequency below .001 is an argument
against ruling out the possibility that such sources exist for global warming
as well.
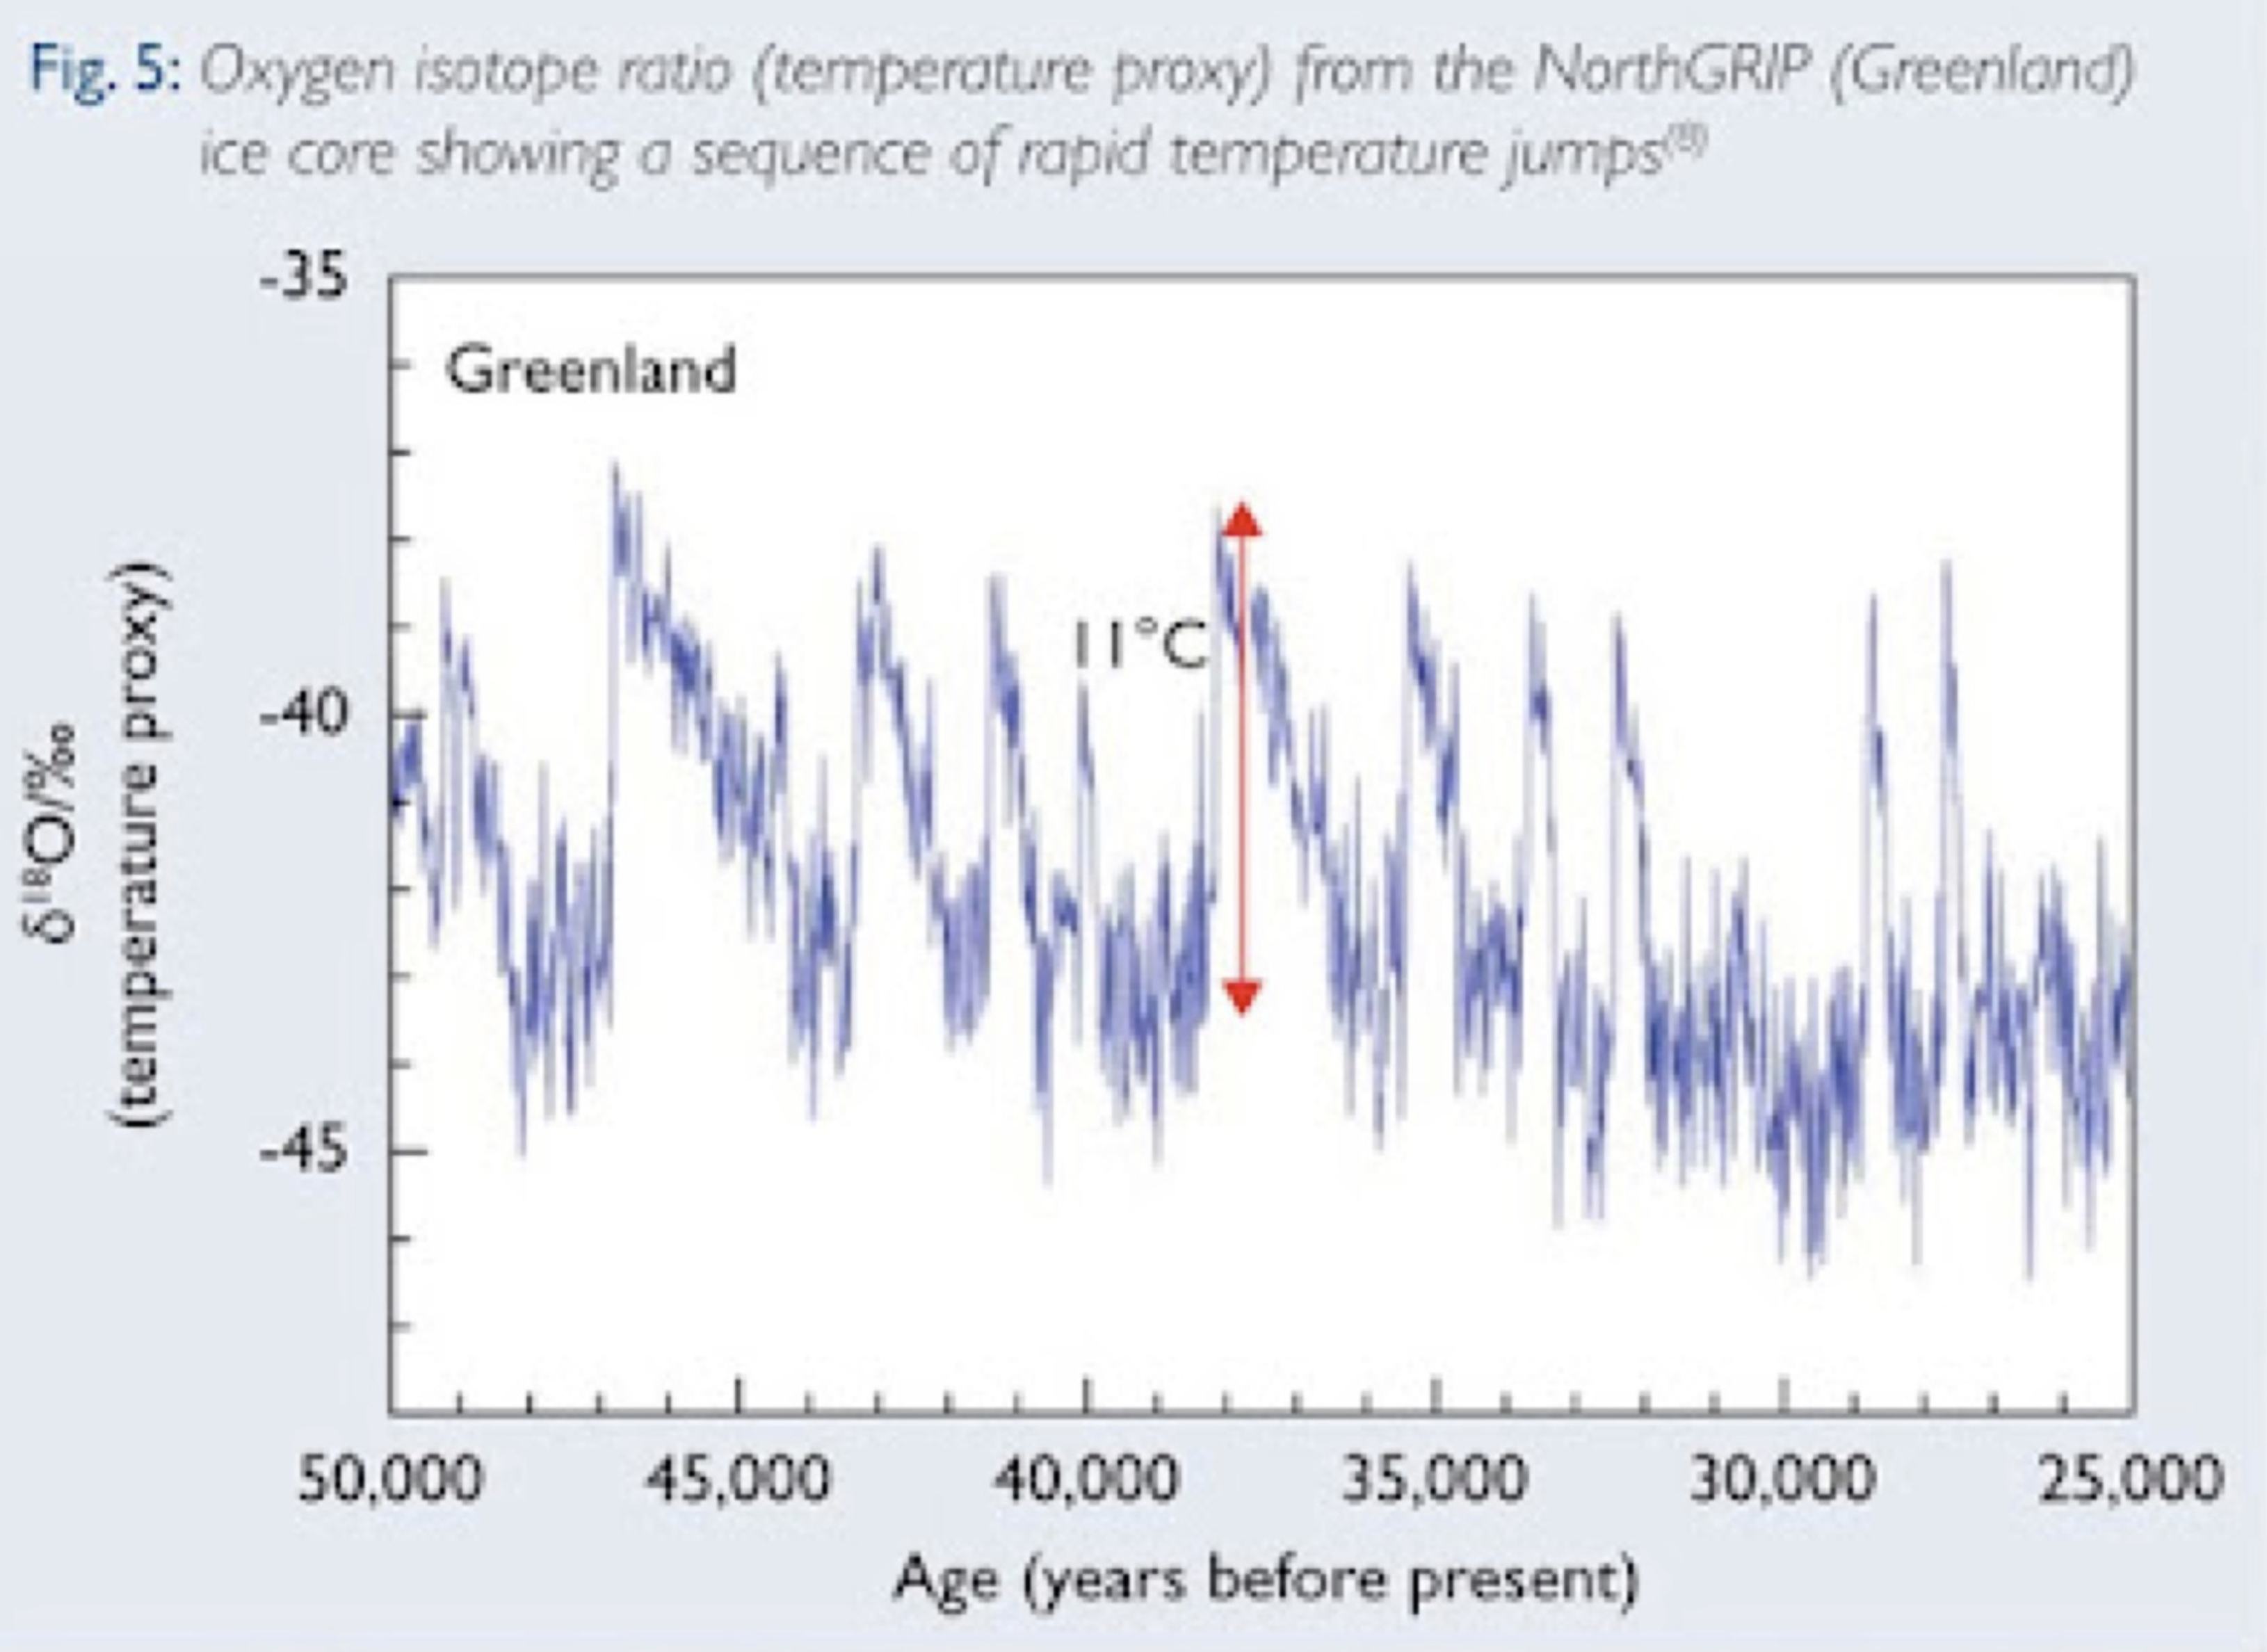
Lovejoy responded
on my blog.
In order to calculate the probability that what happened could happen as a
result of natural causes of temperature change, Lovejoy needed a probability
distribution showing what the probability was of a natural cause producing any
given temperature change. He could estimate that distribution by looking at
changes over the period from 1500 to 1880 on the (plausible) assumption that
humans had little effect on global temperature over that period. But that data
could not tell him the probability distribution for events rare enough to be
unlikely to show up in his data, for instance some cause of warming that
occurred with an annual probability of only .001.
His solution to that problem was to assume a probability distribution, more
precisely a range of possible distributions, fit it with the data he had and
deduce from it the probability of the rare large events that might have
provided a natural cause for 20th century warming. That makes sense if those
events are a result of the same processes as the more frequent events, just
less likely versions of them, just as flipping a coin and getting eight heads
in a row is a result of the same processes that give you four, five, or six
heads in a row. But it makes no sense if there are rare large events produced
by some entirely different process, one whose probability the observed events
tell us nothing about—if, for instance, you got four heads in a row by random chance,
forty heads in a row because someone had slipped you a two headed coin.
It occurred to me, after considering a response by Lovejoy, that not only
was such a black swan event possible in the context of climate, one had
occurred. AGW itself is a black swan, a cause of rapid warming whose
probability cannot be deduced by looking at the distribution of climate change
from the period 1500 to 1880.
If the point is not clear, imagine that Lovejoy wrote his article in 1880.
Since rapid warming due to human activity had not yet occurred there would be
no reason for him to distinguish between all causes of warming and natural
causes of warming. He would interpret the results of his calculations as
showing that the probability of warming by a degree C over the next 128 years
was less than .01. He would be assuming away the possibility of a cause of
substantial warming independent of the causes of the past warming in his data,
one whose probability could not be predicted from their probability
distribution.
That cause being, of course, greenhouse gases produced by human action.
In 1999, Mann, Bradley and Hughes published a reconstruction of temperatures
for the past thousand years, later expanded to cover the past two thousand,
based on proxy data. It was described as a hockey stick diagram because it
showed temperature as fairly flat and declining until about the past century,
the handle of the hockey stick, followed by a sharp rise, the blade. One
controversial feature was that it did not show the medieval warm period and the
subsequent little ice age reported by earlier studies. Their results implied
that current temperatures were higher than any in the past two thousand
years, including the peak of the Medieval Warm Period, and that the warming of
the past century was substantially faster than warming in the past.
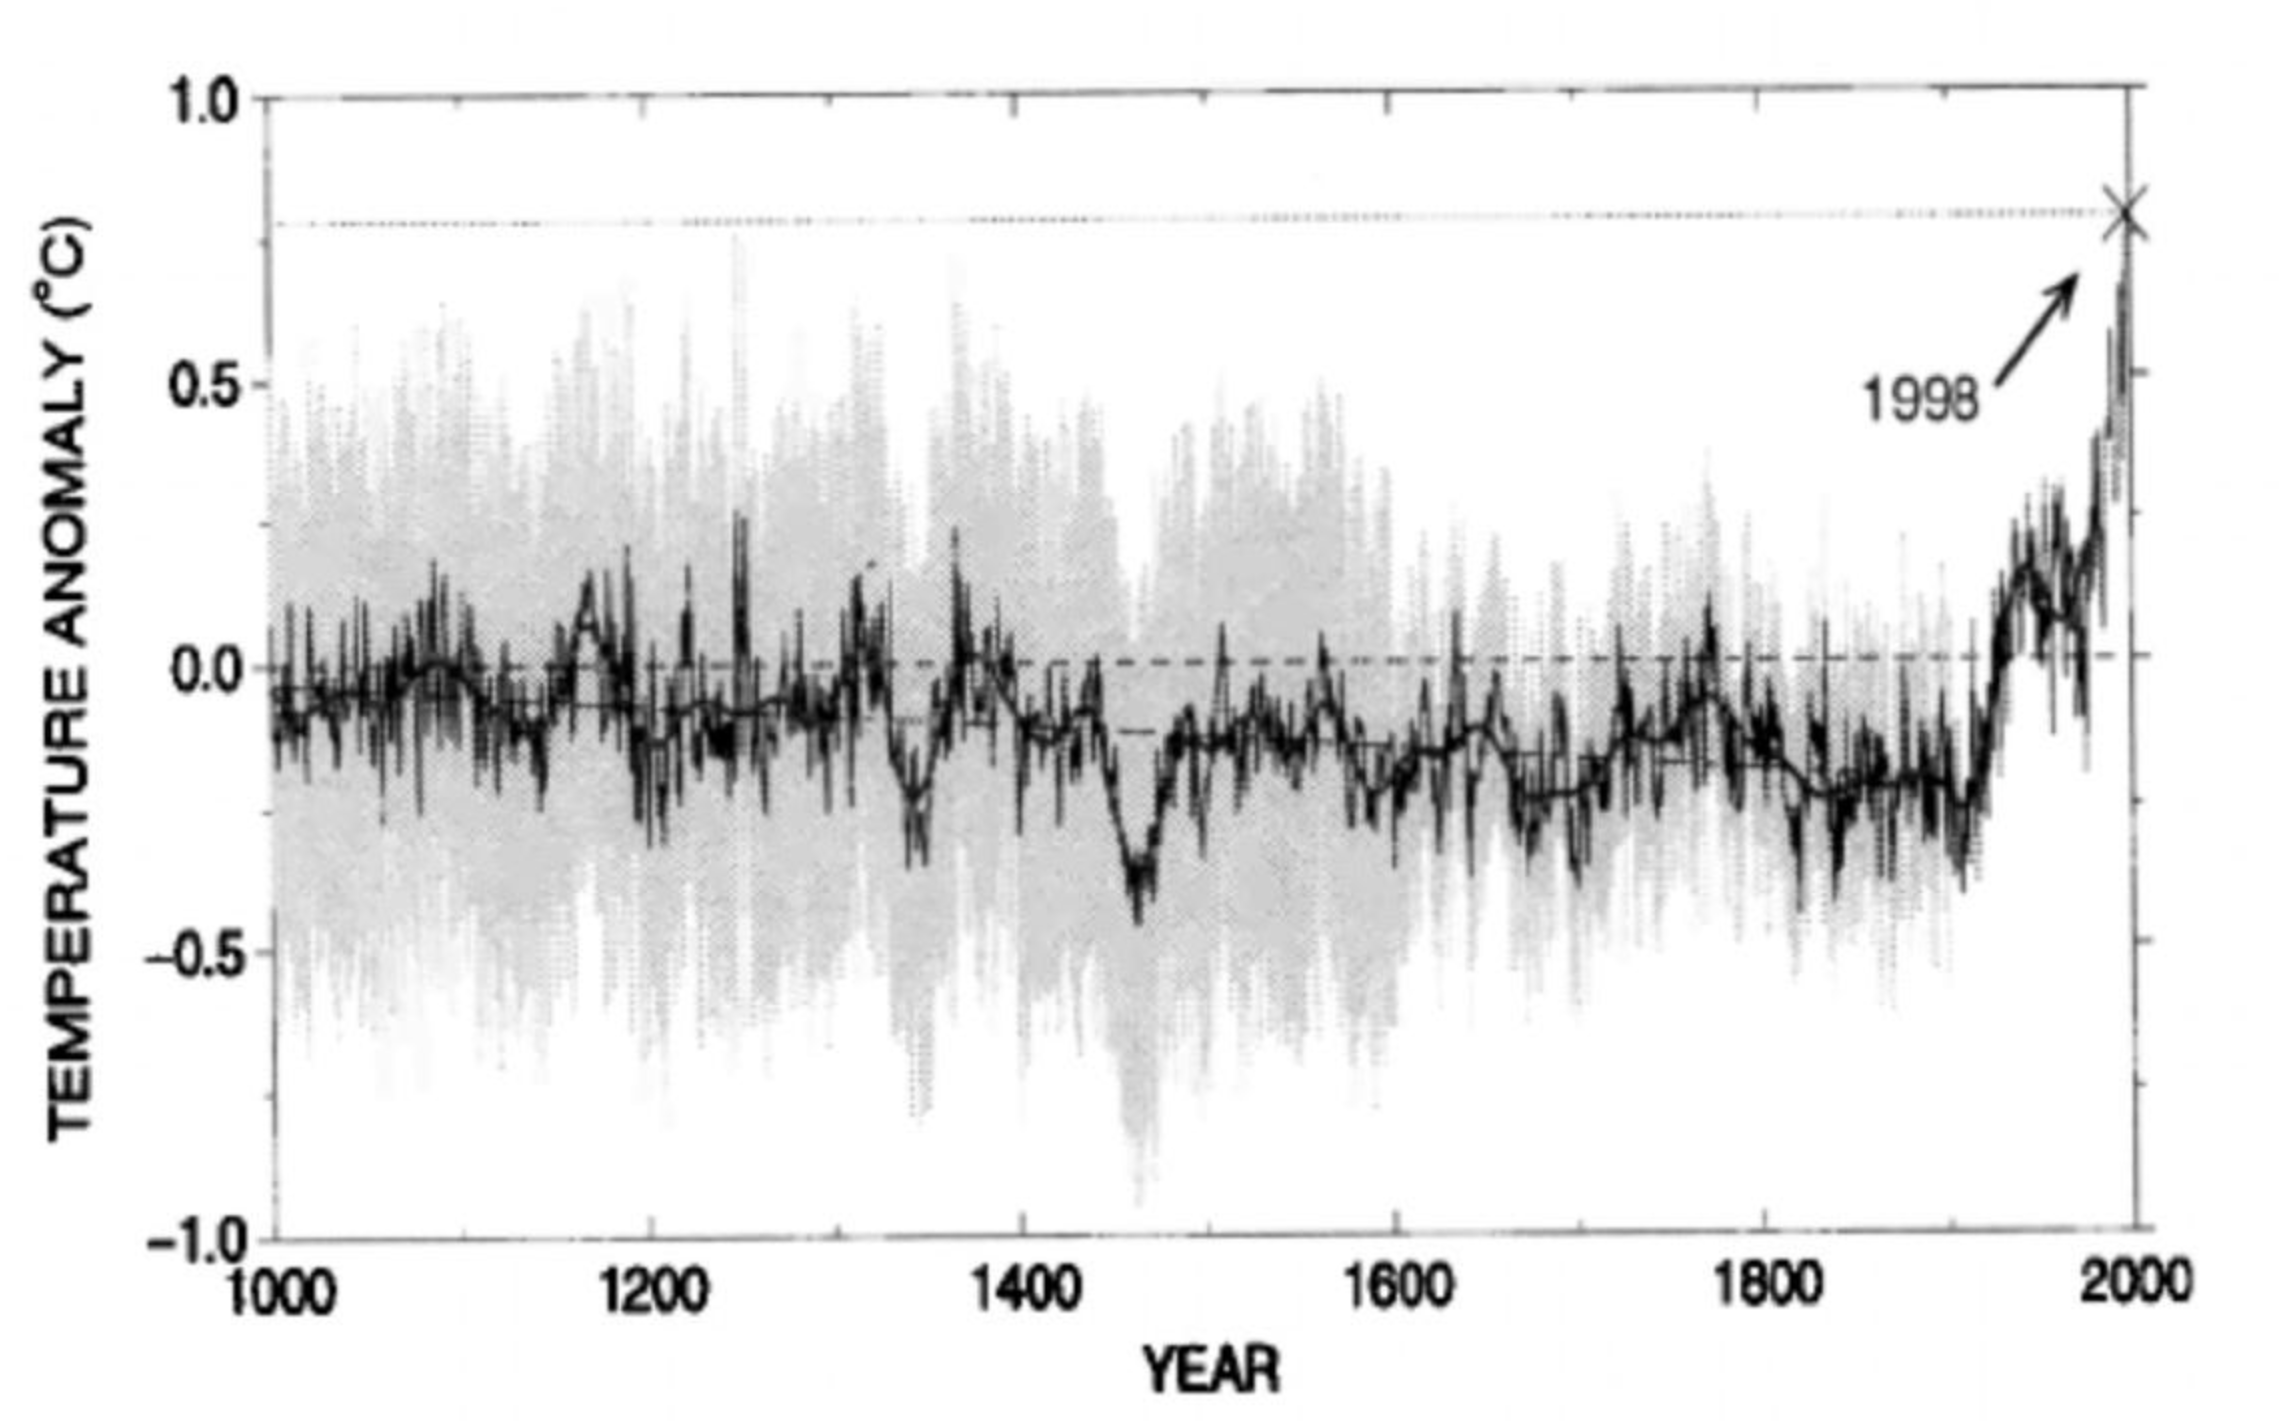
Figure 1 (From Figure 3, Mann, Bradley and Hughes 1999)
Proxies, things affected by temperature, are used to estimate temperatures
for which records of measured temperature do not exist. Thus, for example,
since the rate of growth of trees depends in part on temperature, the
separations between tree rings from old trees can be used to estimate the
temperature when they were formed. Other natural processes produce similar
information. What the precise relationship is can be unclear, in part because a
proxy may be affected by things other than temperature; tree rings might be
narrow not because temperatures were low but because water was scarce, they
might be broad due to CO2 fertilization. It is risky to extrapolate the
relationship beyond the temperatures where it has been observed — the
relationship is commonly modeled as linear but cannot be at all temperatures,
since if it gets hot enough a tree stops growing and dies.
Mann’s work was challenged on a number of bases, two of which were, I think,
important. One was that the proxies used made heavy use of tree ring data,
argued to be an unreliable measure of temperature that happened to show a steep
increase in the past century for reasons unrelated to climate.
The other was that Mann and his coauthors had used a statistical approach which
could be expected to give misleading results, that the long handle of the
hockey stick was a statistical artifact.
Anyone trying to reconstruct temperatures in the distant past has to decide
which proxies to use and how to weight them. Mann and his coauthors did so by
choosing and combining proxies in a way that gave a good fit to the period for
which good instrumental data were available and using the same proxies with the
same weighting to extrapolate back to the earlier period.
That sounds like a reasonable procedure but there is a problem, pointed out
by McIntyre
and others. Each proxy gives a series representing in part temperature, in part
random variation from other causes. Ones for which the random element happens
to make a good fit to the instrumental data will be included, ones for which
the random element makes a poor fit left out. With enough proxies to choose
among it will be possible to select a group whose combined effect makes a close
fit to the instrumental data since with enough parameters you can fit anything.
But the farther back you go before the period whose data they were fitted to,
the less what you get reflects actual temperature, the more uncorrelated random
noise — which explains the straight handle of the hockey stick. The
reconstruction had some relation to actual temperatures, just less than its
authors thought.
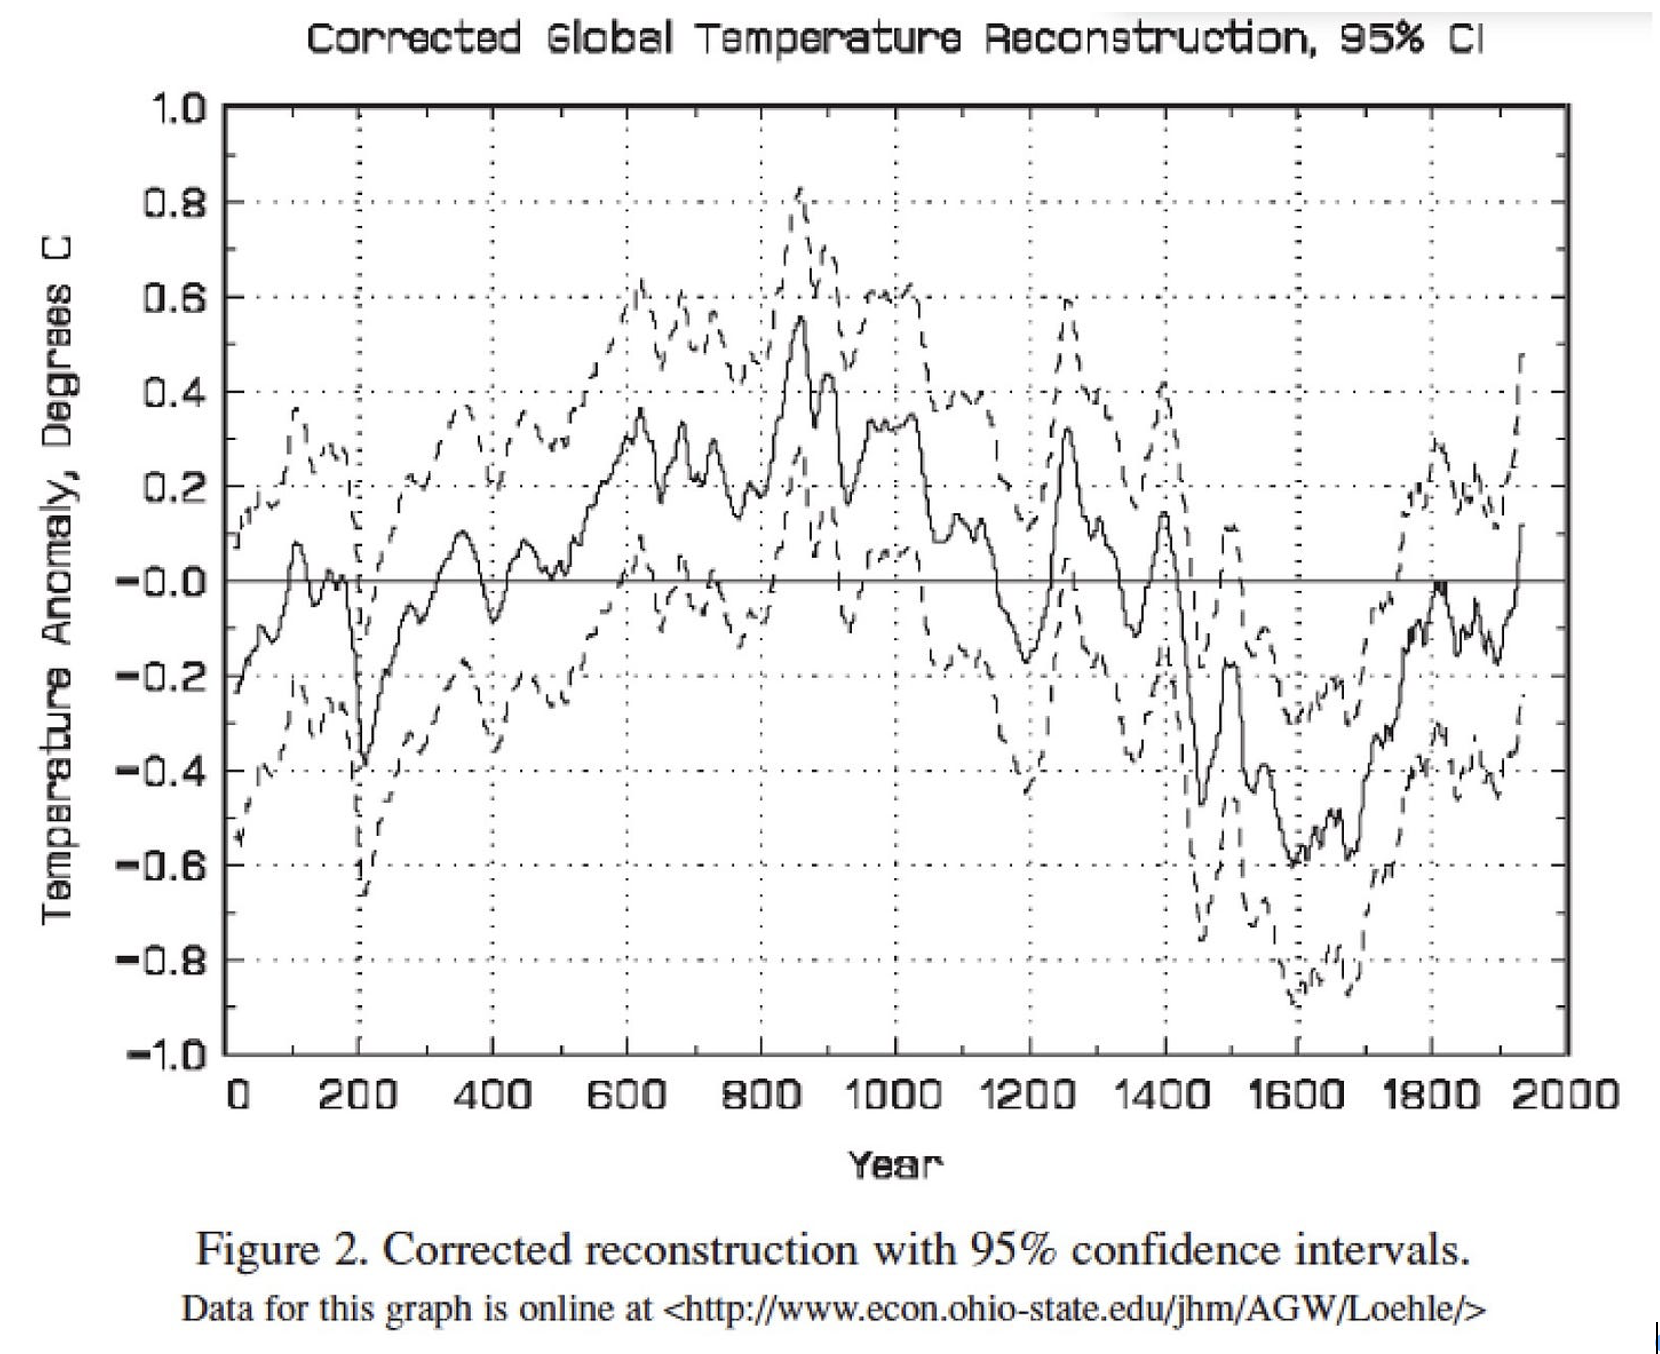
In a later paper,
Loehle et. al. avoided those problems by using estimates of temperature
produced by other scholars from a variety of proxies, excluding any that
depended significantly on tree rings, and calculating the average of their
interpolated values with no attempt to fit them to the instrumental data by
either selection or weighting. Doing that produced the graph of temperature
shown above. Unlike the hockey stick, it shows both the medieval warm period
and the little ice age.
Due to data limitations in the available proxies, the authors only ran the
graph up to 1935, estimating the temperature then at .41°C below the peak of
the medieval warm period. From 1935 to 1999 global temperature rose by another
.60°, making the 1999 temperature .18° higher than their best estimate of the
MWP maximum but still lower than the upper bound of their 95% range. Global
temperature continued to rise and is now above that upper bound.
Their graph shows considerably more natural variation than Mann’s — it no
longer looks like a hockey stick — but not enough to explain recent warming.
The most rapid warming that they show for any substantial period is about
.4°/century, in contrast to about 1.2°/century for warming from 1911 to 2018.
If we accept their estimate as more reliable than Mann’s, as I am inclined
to do, the result remains qualitatively the same but less strikingly so.
Current temperature is the highest in the past two thousand years and warming
over the past century is about three times as rapid as the fastest warming of
the past two thousand years. Temperature has, however, varied considerably more
in the past than shown by Mann’s hockey stick.
That fact is not evidence against human causation for current warming,
although it suggests that natural processes might be responsible for more of it
than one would expect from Mann’s graph. It is mild evidence against the claim
that warming has serious negative effects, since past warming apparently didn’t
— the medieval warm period is generally viewed as having positive effects, the
little ice age negative. The only thing it is strong evidence against is the
reliability of sources of information that boosted the hockey stick graph and
minimized criticism of it — including Mann himself.
A FaceBook post starts:
Is it really a coincidence that so many unprecedented weather
events are happening this year
with a link to a news story about a "once in 50 years" rain in
Japan. It is an argument I frequently see made, explicitly or implicitly. Lots
of unlikely things are happening and there must be a reason. When the subject
is climate change the unlikely things are mostly about climate.
It looks convincing until you think about it. The world is large. There are
lots of different places in it where, if an unusual weather event happens, it
is likely to show up in the news. There are at least four categories of unusual
weather events that could happen—unusually hot, unusually cold, unusually large
amount of rain, unusually small amount of rain—and probably others I haven't
thought of. A year contains four seasons and twelve months and a record in any
of them is newsworthy—a recent news story, for example, claimed that this
August was the hottest August in the tropics on the record.
For a very rough estimate of how many chances there are each year for an
unlikely event to happen and make the news, I calculate:
100 countries prominent enough + 100 cities prominent enough +10
geographic regions (tropics, poles, North America, ...) + 50 U.S. states = 260
times
12 months + 4 seasons=16
times
4 kinds of events that would qualify
=16,640 opportunities each year for an unlikely weather event to occur
and be reported.
So we would expect more than 300 once in 50 years events to happen each year
and about sixteen once in a thousand year events.
My guess is that those number are too low—the story about floods in Japan
does not make it clear whether the one in fifty years record is for the whole
country or only one region. But they at least show why we should expect lots of
unlikely things to happen each year.
If you flip a coin ten times and get ten heads, you should be surprised. If
you flip sixteen thousand coins ten times each, you can expect to get ten heads
about sixteen times—and should not be surprised when you do.
When I put this argument on my blog, one commenter responded:
Baseball in particular seems to provide many illustrations of
this argument. You won't watch long before a commentator explains how the
batter is about to break the record for most consecutive Tuesday afternoon
doubles among National League teams for a right-handed batter against a
left-handed pitcher born outside of the United States after the Paris Peace
Accords.
Another, disagreeing with me, wrote:
People have done stats on this. Extreme stuff is happening
more often than would be expected in the no-warming scenario.
The first question for that claim is not whether it is true but what it
means. Warming results in more extreme high temperatures, fewer extreme low
temperatures.
To add them up you need a common definition of what counts as extreme.
Greenhouse gas warming is greater in cold times and places than in hot, so if
“extreme” is defined as, say, more than five degrees C hotter than the average
over the past x years (for extreme highs) and more than five degrees colder
than average (for extreme lows), the total number of extreme temperatures has
probably gone down — but there are other possible definitions.
Expanding the claim to cover all climate related “extreme stuff” would raise
similar problems. The IPCC projections imply that strong tropical cyclones will
maintain about their current frequency but get a little stronger, weak tropical
cyclones become less common. If we view any tropical cyclone as an
extreme that is a decrease in extreme events, if we count only unusually strong
tropical cyclones, an increase.
How
to Lie With Statistics is an old and good book on how not to be fooled
by statistical tricks. I just came across a trick that, so far as I can
remember (I read the book a long time ago) was not included.
Someone commenting on a Facebook global warming post put up this graph. Two
comments later he wrote "Notice a trend?"
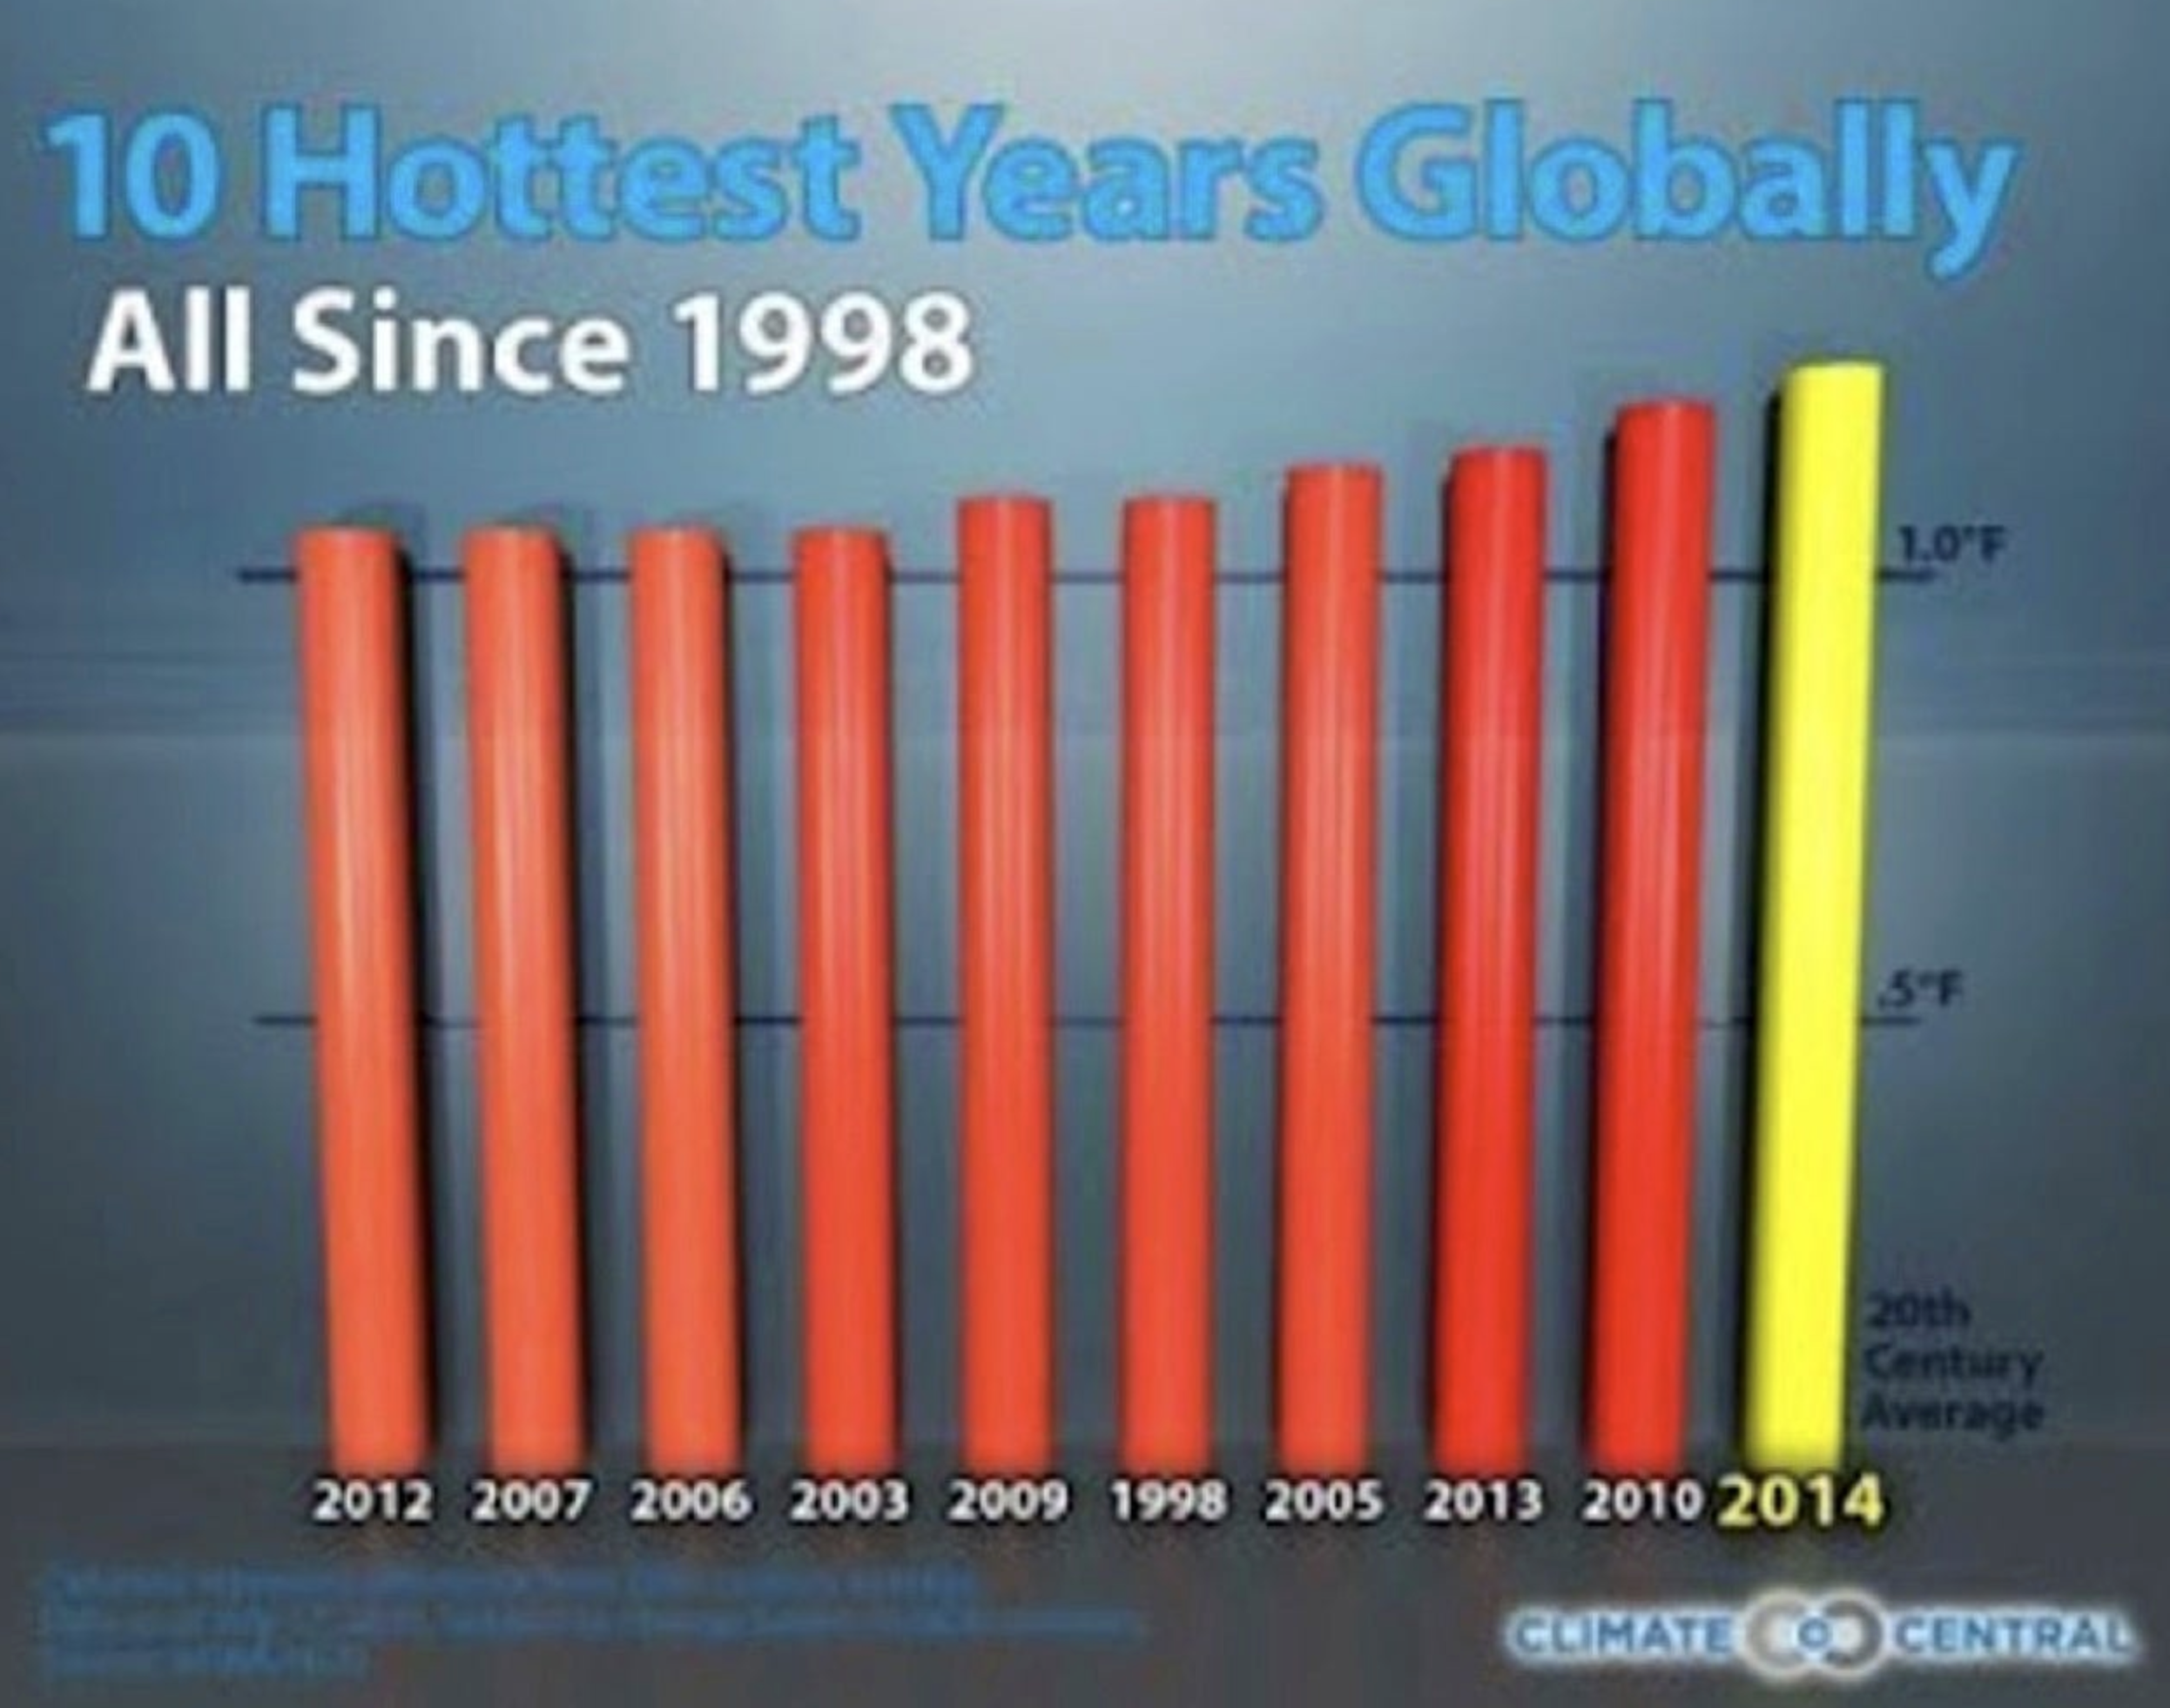
The trick, of course, is that the years are arranged in order of how hot
they were. 2014 is at the right end not because it is the most recent year but
because it was the hottest. 2012 is at the left end because it was the coolest
of the years shown. Arranging them that way guarantees the appearance of a
rising trend, whether temperatures are actually going up or down.
The claim on the graph that those were “the ten hottest years globally” is
false, at least if we accept the webbed NASA
data, which show several years hotter than 2012.
Figuring out entirely by yourself the costs and benefits of climate change
is impossible. All of us, including the professionals in the field, are
dependent on second hand information. An economist or agronomist trying to
estimate the costs of climate change depends on someone else’s estimate of how
much change there will be and with what effects. A climate scientist deciding
whether human production of CO2 is the cause of climate change is
dependent on, among others, paleoclimate researchers who produce proxy evidence
that the current rate of global warming is unprecedented in the periods for
which they have good proxies.
The ordinary layman faces a second level of dependence on other people.
Combining the evidence produced by the professionals in the field is a hard
problem. In practice almost everyone with an opinion on the subject is basing
that opinion on evaluations of the evidence by other people.
I tried to look at the evidence for myself and concluded that we do not know
enough to have confidence in the size, or even the sign, of the net effects of
climate change, that it might make us worse off, might make us better off. In
trying to persuade other people of that conclusion I face the problem that most
of the authoritative sources they rely on confidently predict that the effects
will be negative and large. One way of dealing with that problem is to show my
work, try to sketch the arguments that led me to my conclusion, as I have been
doing.
One problem with that approach is that, for an issue that complicated,
someone can reasonably reject my argument on the grounds that it is incomplete,
omitted important considerations which would change the conclusion, justify the
currently orthodox conclusion.
An alternative approach is to attack not the conclusion but the sources of
information on which other people base their beliefs. If I can show that the
sort of authoritative sources they rely on for information on the effects of
climate change cannot be trusted, are demonstrably biased, incompetent, or
dishonest, that eliminates the basis for their present beliefs. They must then
either conclude that they do not know what the consequences of climate change
will be or do what I have done, try as best they can to put together whatever
facts they believe they can trust to reach their own conclusion.
If a source of information is badly biased, incompetent or dishonest,
demonstrating the fact is easier than demonstrating that its conclusion is
wrong. That was the project of the previous section of this book.
My arguments in all of those cases are simpler and easier for the reader to
check than my arguments on the consequences of climate change. That Nordhaus
wildly exaggerated the implication of his own research you can check by reading
what he wrote about the cost of waiting, looking up global GNP, and dividing.
Checking the others requires a little more work but not a lot and I provided
the necessary links.
Consider the implications if my claims are true. That John Cook lied about
the results of his own article tells us that he is an unreliable source of
information, is a reason to distrust his blog (Skeptical Science), but tells us
nothing about other and more important sources of climate information. The fact
that his widely quoted 97% claim can be shown to be false by a careful reading
of the article it is based on and yet no one on his side of the argument, at
least nobody I could find, pointed that out, is evidence that his intellectual
allies are unwilling or unable to recognize dishonest work in support of
conclusions they agree with.
An article published in Nature has been through peer review. Either
it did not occur to any reviewer that improvements in medical technology over
the next three centuries would have some effect on how many people died from
warmer temperatures or the reviewers noticed but said nothing or reviewers
pointed out the problem and the authors and journal editors ignored it.
A textbook that has been out for more than ten years and successful enough
to be in its third edition has been looked at and used by many professors.
Either none of them noticed multiple obvious mistakes, all biasing the
conclusion in the same direction, or they did not think it worth reporting them
to the author, or he did not think it worth correcting them.
Either Nordhaus did not bother to do the arithmetic to determine the
implications of his own research or he deliberately misrepresented them.
The conclusion is that the mechanisms for providing reliable information
about the consequences of climate change are badly broken, that sources of
information that satisfy the obvious criteria for reliable authorities are
quite likely to say things that are not true.
One response, if you find this convincing, is climate agnosticism. You now
know that you do not know what the net effects of climate change are likely to
be. The alternative is to try to do what I have tried to do, work out for
yourself what the implications of the evidence are.
You cannot, as I could not, establish the basic facts for yourself; that was
a project that required the work of thousands of researchers over many years.
You need to find sources you can rely on for the facts on which to base your
conclusions. In doing so, you can use the same approach I have used to find
sources you cannot rely on, evaluate sources of information on internal
evidence and consistency with other sources, then get your information from
ones that pass that test.
I believe the IPCC reports qualify. The body of the reports appears to be
honest if mildly biased, inclined to pay more attention to costs of climate
change than to benefits. The Summary for Policymakers, which is all most will
read, is more biased and mildly dishonest, but you don’t have to rely on it.
I have two reasons to believe the body of the report is honest. The first is
that it quite frequently reports facts that undermine the conclusion that
climate change is a bad thing, although those facts rarely show up in news
stories. One example is the fact that some projections show climate change
resulting in greening the Sahara and Sahel. Another is that the globe overall
is greening, increasing the area of leaves, probably as a result of CO2
fertilization. A third is that the total number of tropical cyclones is
projected to decrease as a result of climate change.
The scientific section of the latest report (IPCC AR6 WGI) runs to almost
four thousand pages, largely of detailed analysis, depending on multiple
scholarly articles for each step — Chapter 7, to pick one at random, has fifty
editors and about nine hundred articles in its list of references. Someone with
unlimited time, energy and expertise might be able to go through all of the
calculations that produced the predictions in the reports in order to see if
they were done correctly, but that is not a practical option. How can the
reader know whether to trust calculations he cannot work through for himself?
The climate system is too complicated to make predictions on the basis of
theory alone possible, hence the IPCC project largely consists of sophisticated
curve fitting, picking a form for the relationships among observables suggested
by physical theory, choosing parameters for the relationships, how strong each
effect is, by finding the values that best fit historical data. With
enough tweaking of the models and adjusting of parameters that process can fit
past data — with enough parameters you can fit the skyline of New York — but that
does not tell you whether the models will correctly predict future data..
The solution is to test the model against data that were not used in
creating it. We do not know the future, the future eventually becomes the past,
so a model constructed in 1990 can be tested in 2025 against data that did not
exist when the model was constructed.
The past IPCC reports are webbed. Back in 2014, after observing people on
one side of the argument claiming that the models did a good job of predicting
temperature changes, people on the other side that they did a terrible job,
I looked at each of the first four reports to see what someone who read
it would expect future temperature to do and reported
the results on my blog. The conclusion was that the IPCC had predicted high
four times out of four, twice by enough so that actual warming was below the
bottom of the predicted range. That looked like evidence that we should not put
much weight on their predictions of future temperature. I did it a second time
in 2021 and by then the IPCC looked better; high three times out of four, low
once, and only once was actual warming below the predicted range.
I have now done it a third time, with data
up to 2024. If you would like to check my conclusions about what each report
implied for yourself you can find links to the reports here.
The executive summary of the first report (1990) contains:
Under the IPCC Business-as-Usual (Scenario A) emissions of
greenhouse gases, the average rate of increase of global mean temperature
during the next century is estimated to be about 0.3°C per decade (with an
uncertainty range of 0.2°C to 0.5°C).
The graph shown for the increase is close to a straight line at least from
2000 on, so it seems reasonable to ask whether the average increase from 1990
to the present is within that range.
Figure 18 from the Second Assessment Report (1995) shows the future
temperature through 2020. Through that date, it rises steadily at about
.14°C/decade.
From the Third Assessment Report (2001):
For the periods 1990 to 2025 and 1990 to 2050, the projected
increases are 0.4 to 1.1°C and 0.8 to 2.6°C, respectively.
For the former period, that implies an increase of from .11 to .31
°C/decade.
The Fourth Assessment Report (2007) has:
For the next two decades a warming of about 0.2°C per decade
is projected for a range of SRES emissions scenarios.
I redid the calculations again in 2025, using data
through 2024.
The results:
The first IPCC report was released in 1990. From then to 2024 global
temperature rose 1.28°C for an average of .24°C/decade, still low but now
within the predicted range.
The second report was released in 1995. From then to 2020, temperature rose
by .54°C, for an average rate of growth of .22 °C/decade, higher than the
predicted .14.
The third report was released in 2001. From then to 2024 temperature rose by
.73°C for an average of .32°C/decade, just above the upper end of the predicted
range.
The fourth report was released in 2007. From then until 2018, temperature
rose by .64 degrees, .38°C/decade, well above the predicted .2°C/decade.
The IPCC reports rely on complicated models and a lot of data. One way to
judge how good a job they have done of modelling climate is to compare their
results with those of much simpler models. The simplest plausible model is a
linear regression, fitting the data to a straight line. Looking at the graph,
warming starts about 1910, stops about 1934, restarts about 1965. Linear
regressions starting in 1910 give a very poor fit so instead I did them
starting in 1965. In 1990 the simple model would be a linear fit of temperature
from 1965 to 1990.
The slope of that line is .18°C/decade, so that is what the simple model
predicts for warming thereafter. I repeated the calculation for the dates of
the other three reports.
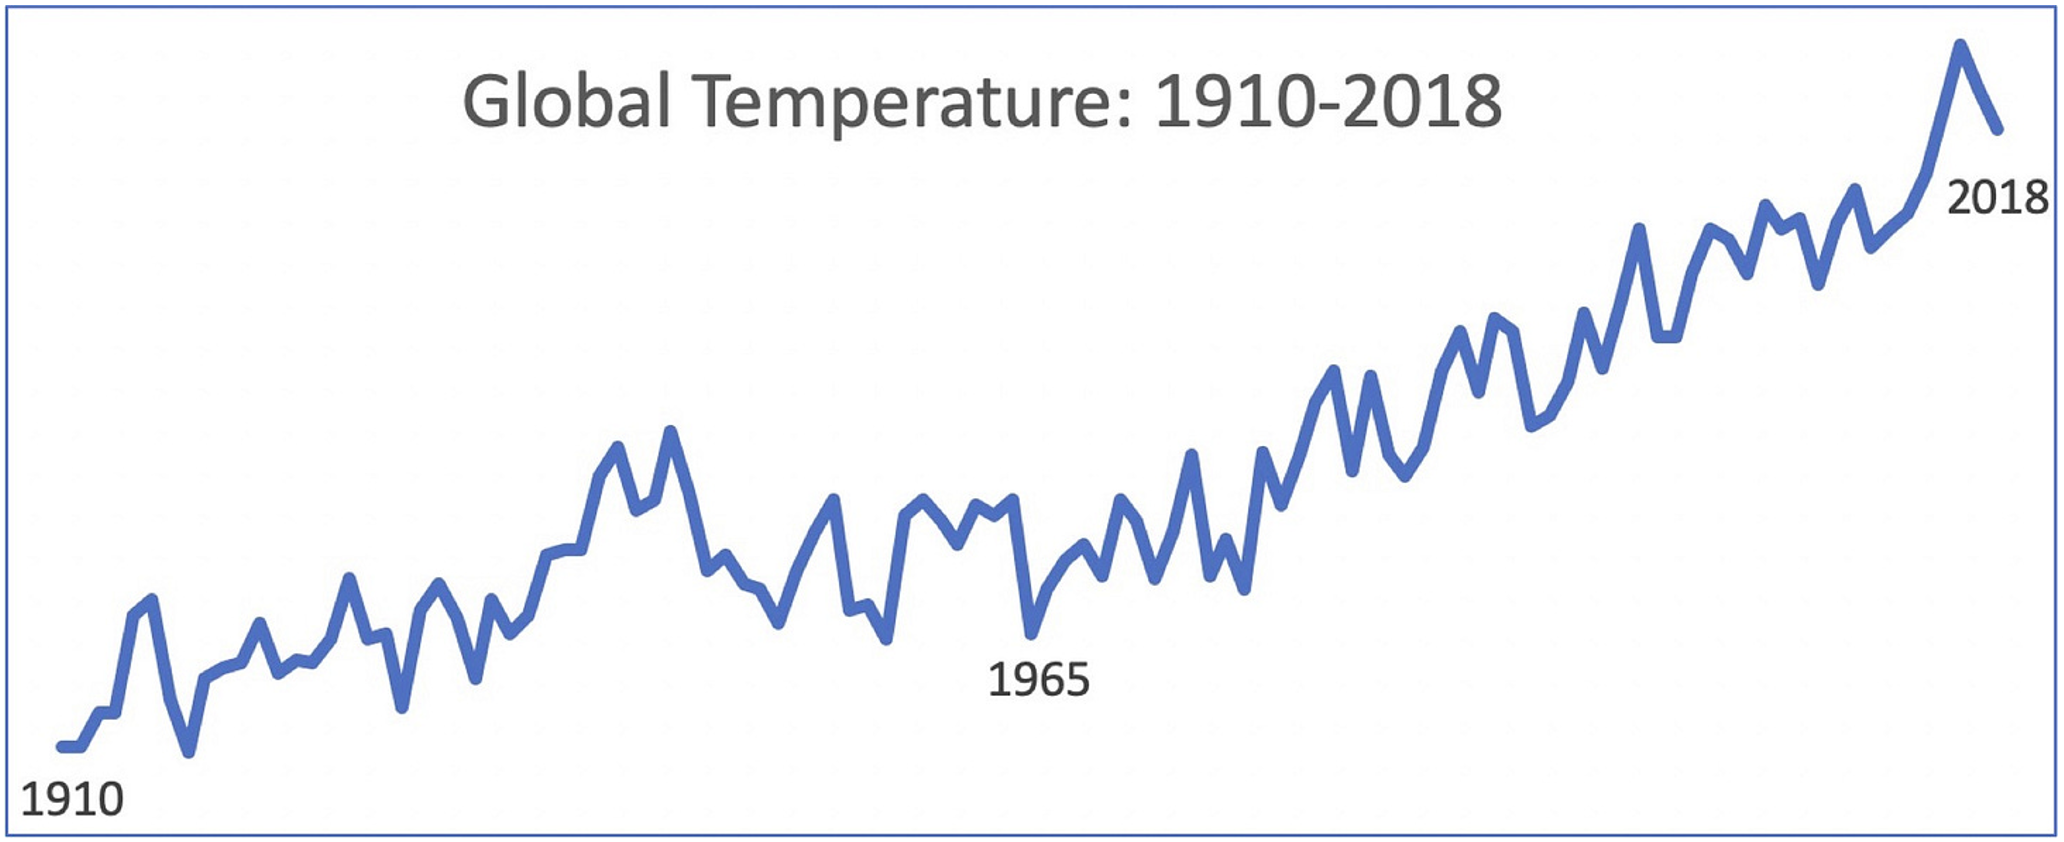
The table shows the results. “Regression slope” is the slope
of the regression line, hence the rate of warming it shows. “Projected slope”
is the slope implied by the IPCC report,
“actual slope the rate of warming from the date of the report to 2024. All
warming rates are in °C per decade.
|
Table 15-1
|
|
Report
|
Regression Slope
|
Projected Slope
|
Actual Slope
|
|
1990
|
.18
|
.30
|
.24
|
|
1995
|
.16
|
.14
|
.22
|
|
2001
|
.16
|
.21
|
.32
|
|
2007
|
.17
|
.20
|
.38
|
The second time I did the calculation, using 2018 temperatures, the warming
rate predicted by the regression beat the IPCC prediction four times out of
four. This time, using 2024 data, the two methods tie once, the IPCC beats the
regression twice, loses to it once. And neither looks very good.
On the other hand, the result of the latest comparison is evidence that the
IPCC is not biasing their results to make warming look faster than it is, since
their projections after the first have been low, not high.
From the standpoint of an economist, the logic of global warming is
straightforward. There are costs to letting it happen, there are costs to
preventing it, and by comparing the two we decide what, if anything, ought to
be done. Many of the people supporting policies to reduce climate change do not
see the question that way, however. Some of what I see as costs, they see as
benefits.
Reduced energy use is a cost if you approve of other people being able to do
what they want, which includes choosing to live in the suburbs, drive cars
instead of taking mass transit, heat or air condition their homes to what they
find a comfortable temperature. It is a benefit if you believe that you know
better than other people how they should live their lives, know that a European
style inner city with a dense population, local stores, local jobs, mass
transit instead of private cars, is a better, more human lifestyle than living
in anonymous suburbs, commuting to work, knowing few of your neighbors. It is
an attitude that I associate with an old song about little boxes
made of ticky-tacky, houses the singer was confident that people shouldn't be
living in, occupied by people whose life style she disapproved of. A very
arrogant, and very human, attitude.
There are least three obvious candidates for reducing global warming that do
not require a reduction in energy use. One is nuclear power, a well established
if currently somewhat expensive technology that produces no CO2 and
can be expanded more or less without limit. One is natural gas, which produces
considerably less carbon dioxide per unit of power than coal, for which it is
the obvious substitute. Fracking has now sharply lowered the price of natural
gas with the result that U.S. output of CO2 peaked in 2007, has been
generally declining since then, is currently about 80% of its peak value. The
third and more speculative candidate is geoengineering, one or another of
several approaches that have been suggested for cooling earth without reducing
CO2 output.
One would expect that someone seriously worried about global warming would
take an interest in all three alternatives. In each case there are arguments
against as well as arguments for, but someone who sees global warming as a
serious, perhaps existential, problem ought to be biased in favor, inclined to
look for arguments for, not arguments against.
That is not how people who campaign against global warming act. In my
experience they are less likely than others, not more, to support nuclear
power, to approve of fracking as a way of producing lots of cheap natural gas,
to be in favor of experiments to see whether one or another version of
geoengineering will work. That makes little sense if they see a reduction in
power consumption as a cost, quite a lot if they see it as a benefit.
The cartoon shown below, which gets posted to Facebook by people arguing for
policies to reduce global warming, implies that they are policies they would be
in favor of even if warming was not a problem. It apparently does not occur to
them that that is a reason for others to distrust their claims about the perils
of climate change.
Most would see the point in a commercial context, realize that the fact that
someone is trying to sell you a used car is a good reason to be skeptical of
his account of what condition it is in. Most would recognize it in the
political context, providing it was not their politics; many believe that
criticism of CAGW is largely fueled by the self-interest of oil
companies. It apparently does not occur to them that the same argument
applies to them, that from the standpoint of the people they want to convince the
cartoon is a reason to be more skeptical of their views, not less.
That is an argument for skepticism of my views as well. Belief in the
dangers of climate change provides arguments for policies, large scale
government intervention in how people live their lives, that I, as a
libertarian, disapprove of, giving me an incentive to believe that climate
change is not very dangerous. That is a reason why people who read my writings
on the subject should evaluate the arguments and evidence on their merits, not
simply believe something because I say it.
I have focused on global warming but the pattern of using something that can
be represented as a crisis as an excuse to do things by people who want to do
them exists in other contexts and across the political spectrum. The approach
is perhaps best summed up in a quote attributed to Rahm Emanuel, back when he
was working for Obama:
You never let a serious crisis go to waste. And what I
mean by that it's an opportunity to do things you think you could not do
before.
The argument for sharply increasing federal spending and doing it with
borrowed money was that it was an emergency measure made necessary by the
economic crisis. For Rahm Emanuel, and presumably his boss, it was an
opportunity to do things they would have wanted to do whether or not there was
a crisis. Later, the argument for suspending payments of rent and of interest
on school loans was that it was necessary to enable people to manage with lower
incomes due to precautions against Covid. For first Trump and then Biden, it
was a way of increasing their political popularity with the beneficiaries;
Biden remained in favor of it after the crisis claimed to justify it ended. For
an example in the climate context, consider biofuels policy, initially
introduced as a way of holding down CO2 emissions. As Al Gore later,
to his credit, confessed:
One of the reasons I made that mistake [support for biofuel
policy] is that I paid particular attention to the farmers in my home state of
Tennessee, and I had a certain fondness for the farmers in the state of Iowa
because I was about to run for president
Gore and other environmentalists eventually concluded that producing maize
and converting it to alcohol produced about as much CO2 as the
petroleum it replaced. Nonetheless it is still happening, consuming more than
ten percent of the world output of maize; pushing up the price of maize raises
the income of American farmers, making biofuels a policy that neither party is
willing to oppose.
“The whole aim of practical politics is to keep the populace
alarmed (and hence clamorous to be led to safety) by an endless series of
hobgoblins, most of them imaginary.”
― H.L. Mencken, In
Defense of Women
For another example of the predicted effect of a policy being seen by some
as a cost, by some as a benefit, consider the abortion issue. One consequence
of an abortion ban is to make non-marital sex riskier. From the standpoint of
someone who enjoys sex that is a cost. From the standpoint of someone who
regards non-marital sex as sinful, as many supporters of abortion bans do, it
is a benefit. It may also be a benefit from the standpoint of someone who
believes that the sexual revolution had, on net, negative consequences, was
responsible for the breakdown of marriage in modern societies.
Similar arguments apply to the Catholic opposition to abortion and
contraception.
I do it too. Opponents of educational vouchers see one of the benefits of
the public school system, hence one of the costs of replacing it in part with
private schools, as creating a common national culture, making sure that all
children are taught about the same things. I see that as a cost; it is harder
to eliminate false beliefs if everyone holds them. Better to have diversity in
belief in the hope that more nearly true beliefs will tend to win out, even if
initially held by only a minority.
The same issue arises in the context of home schooling. Opponents of home
schooling see it as a way in which people with heterodox beliefs, such as
religious fundamentalists, can pass their beliefs on to their children. Since I
was brought up in a family with heterodox beliefs, although not religious ones,
and enjoy interacting with people whose views are very different from mine, I
see that as a benefit.
I have argued in previous chapters that we have no reason to expect climate
change to have large net negative effects. Yet quite a lot of countries are
doing expensive things that are defended as ways of reducing climate change:
subsidizing renewables and electric cars, forcing the conversion of maize into
alcohol, discouraging the production and use of fossil fuels.
Even if slowing climate change is worth doing, why anyone does it is a
puzzle. For countries as for individuals, reducing climate change faces a
public good problem. If Canada imposes costs on itself in order to reduce its
output of CO2 any benefits are shared with the rest of the world. In
order for Canada’s tiny share of the benefits to be worth the cost to Canadians,
benefits must be not only larger than costs, they must be many times larger.
Yet not only does the country of Canada adopt expensive policies to reduce CO2
production so does the state of California, whose share of global CO2
output is somewhere around a tenth of a percent.
Consider another public good problem, one that nations have been failing to
solve for a very long time. If all countries cut their military spending in
half they would save a great deal of money and relative power should remain
about the same. There have been occasional attempts at treaties limiting
armaments, such as the naval limitation treaties after World War I, treaties
typically confined to a few of the most powerful countries — it is easier to
solve a public good problem by coordinated action if it only a few players are
involved. But that attempt was ultimately unsuccessful, as demonstrated by the
arms buildup preceding World War II.
For a different outcome and a possible answer, consider the problem of
preventing nuclear warfare. A nuclear power that refrains from using nuclear
weapons against a non-nuclear opponent — the U.S. in Vietnam or Russia in
Ukraine — bears the cost of a more difficult conflict, shares with the rest of
the world the benefit of a reduced chance of a future nuclear exchange.
And yet, although multiple nations with nuclear weapons have been
involved in conflicts with non-nuclear opponents, since Hiroshima and Nagasaki
no nuclear weapons have been used.
The explanation might be the amount at stake; preventing the first use of
nuclear weapons by an implicit agreement among the nuclear powers is widely
viewed as preventing the first step towards nuclear catastrophe. The larger the
benefit to producing a public good the greater the incentive to produce it even
for an actor who knows he will receive only part of the benefit. That suggests
a possible explanation for the behavior of nations with regard to climate
change; people who view climate change as not merely a cost but a catastrophe
might be willing to support expensive policies to prevent it even if they
realize that their production of CO2 is only a small part of the
problem.
So one possible explanation is that the people making the decisions believe
in not only AGW but CAGW, Catastrophic Anthropogenic Global Warming. That
leaves the puzzle of why they believe in it if, as I have been arguing, there
is no good reason to.
The pattern of policies advocated and adopted might be a clue. The only
source of power we have that produces no CO2, is not intermittent
and can be expanded without limit is nuclear power. There are arguments for and
against it on other grounds but one would expect concern with climate change to
shift policy in its favor. Yet at the same time Germany was adopting expensive
policies to increase renewables and reduce the use of fossil fuels it was
shutting down reactors. California did the same. And while a few campaigners
against climate change, such as James Hansen, are pro-nuclear, most are not.
So far I have been working on the implicit assumption that governments try
to act in the interest of their citizens. Public choice theory, the branch of
economics that deals with political behavior, suggests that that is a mistake.
The individuals whose decisions determine what governments do, whether voters,
legislators, or government officials, can be expected, like the same
individuals in the private market, to act for their own objectives not the
general good. The mechanism that is supposed to produce government policy in
the general interest is democratic voting, but that assumes that voters know
what policies have what effects. Becoming a well-informed voter requires you to
bear significant costs in exchange for a very small chance of a very small fraction
of the benefit of electing the better candidate. An additional cost is the risk
of reaching conclusions that could make you unpopular with people who matter to
you.
It is rational to be ignorant of information that costs more than it is
worth. One implication is that people choose how to vote largely on the basis
of free information, what everyone knows, whether or not it is true. A lot of
free information comes in the form of news in newspapers, television, online.
People consume news less to get information — most of what they read is
irrelevant to how it is in their interest to act — than to be entertained,
hence the incentives of the people who provide news are heavily biased in the
direction of telling a good story, whether or not true. Climate catastrophe is
a much better story than climate change making us a few percent poorer.
A further implication is that how people vote, more generally what positions
they hold, will be determined not by the effect of their vote on electoral
outcomes but by its effect on themselves. If a candidate offers a view of the
world that makes you feel good about yourself that is a reason to believe him.
If the people around you hold views that imply that good people support the
positions of one candidate, bad people those of his opponent, agreeing with
them makes your life a good deal pleasanter. Your belief about what model of
car is best for you determines what car you get but what you believe about
climate change has almost no effect on how much climate change happens or what
is done to prevent it, so whether a belief is true is largely irrelevant whether
it is in your interest to believe it. Daniel Kahan, a Yale professor who has
studied the pattern of beliefs on issues linked to group identity such as
evolution or gun control,
found that the more intellectually able someone was, the more likely he was to
agree with the position of the group he identified with, whether that meant
believing in evolution or not believing in it.
All of this suggests that what people believe and how they vote will be
largely determined by what beliefs make good stories, what beliefs make them
feel good about themselves, what beliefs are held by those around them, what
ideas are pushed by information sources they rely on. My conclusion that
climate change is not a serious threat may or may not be correct but it is not
inconsistent with the observation that enough people believe it is to make
expensive policies to reduce it politically profitable.
That way of looking at it suggests that for some environmentalism functions
as a religion replacement, a source of a moral pattern in their lives, a reason
to believe they are working for good.
That fits the hostility to nuclear power, since opposition first to nuclear
weapons and then to nuclear power is an older tenet of the same faith. It also
helps to explain the extreme claims; end of the world prophecies have played an
important role in past religious movements. Just as in those cases, the failure
of one prophecy frequently leads not to loss of faith but a revision in detail,
pushing the doom from the observed present to the unobservable future. It also
explains why environmental catastrophism is less popular with people who
already have a religion they take seriously.
And finally, it explains Canada and California — twice over. If you believe
that the stakes are large enough, even a small contribution to victory is worth
making. And if you know that working for the cause, however little you can
contribute, is virtuous, what good people do, you do it, ignoring the cold
arithmetic of cost against benefit. And even if you are not a true believer, if
enough of the people around you share the religion it may be prudent to act as
if you do.
Treatment of climate in the IPCC reports, especially in the summary for
policy makers, is biased but, so far as I can tell, mostly honest.
Unfortunately, few people read the IPCC report and those who do mostly
read only the summary for policy makers, which in my experience is the most
biased and least scientific part of the report. Most people get their views on
climate issues at second, third or fourth hand from news stories, blogs,
YouTube channels, friends and acquaintances. Most reporters do not understand
the issues and even climate scientists are unlikely to understand subjects that
feed into views on climate such as economics, geology, or statistics. The
result is that most people’s beliefs about climate issues have only a loose
relation with the truth.
The major media and the academy are dominated by people who, in my view,
overestimate the problem, so the most common errors are in that direction.
There may be equally bad errors in the views of some on the other side of the
argument but those are not the subject of this chapter.
I started blogging in 2005, first discussed climate in 2006. In the years
since I have been repeatedly struck by the contrast between the IPCC reports
and media accounts of them, starting with the Fourth Assessment report in 2007.
From a news
story:
Climate change is "severe and so sweeping that only
urgent, global action" can head it off, a United Nations scientific panel
said in a report on global warming issued Saturday.
The report produced by the Nobel prize-winning panel warns of
the devastating impact for developing countries and the threat of species
extinction posed by the climate crisis. (news
story)
...
The report also predicts a rise in global warming of around
0.2 degrees Celsius per decade."
"Nobel prize-winning" sounds like evidence of scientific expertise
but although the IPCC includes a lot of highly qualified scientists, the fact
that the commission got the Nobel peace prize tells us nothing about its
scientific qualifications. Al Gore got the peace prize too, and he is a
politician not a scientist.
The emotive part of the story — "crisis" "species
extinction" "devastating impact" — comes first and gets the
attention. The actual prediction, an increase of less than two degrees by the
end of the century, not what most people imagine when they talk about global
warming, is buried down in "also predicts."
From the IPCC, in contrast:
Globally, the potential for food production is expected to
increase with increases in average temperature over a range of 1-3 degrees
centigrade, but above this it is projected to decrease.
Or in other words, given what was then the predicted temperature increase of
about .2 degrees/decade, global warming was expected to increase food
production for the next fifty to hundred and fifty years. I did not notice that
prediction in news stories about the report.
Similarly:
Globally, commercial timber productivity rises modestly with
climate change in the short- to medium-term, ...
In some cases the problem is with the wording of the report itself:
Nearly all European regions are anticipated to be negatively
affected by some future impacts of climate change, ... .
Note the word "some." It is hard to imagine any substantial change
in the world, good or bad, for which the statement would not be true. If, for
example, we found a cure for cancer, one effect would be to extend life
expectancies, pushing the social security system further into the red, another
to reduce job opportunities for cancer surgeons.
The IPCC predicted global temperature increases of 1.8 to 4
degrees Celsius (3.2 to 7.1 degrees Fahrenheit) by 2100 and sea levels to rise
between 7 and 23 inches (18 and 58 centimeters) by the end of the century. ...
'An additional 3.9-7.8 inches (10-20 centimeters) are
possible if recent, surprising melting of polar ice sheets continues,' the
report stated. (From CNN)
Talk about the danger of rising sea levels, at least in my experience, is
usually accompanied by verbal or visual images of Florida flooding, Manhattan
and London under water, and similar catastrophes. If the IPCC figures were
correct, the upper end of the range of what might actually happen was a rise of
less than a meter over a century, considerably less than the distance between
high tide and low.
Consider, for one example, a picture
of the National Mall in DC flooded with 3°C warming. In the small print at
the bottom: “these sea levels may take hundreds of years to be fully realized.”
The picture
below purports to show New York after eight feet of rise.

The next image is New York from the flood
maps page showing how much of Manhattan is within three meters, about ten
feet, of sea level
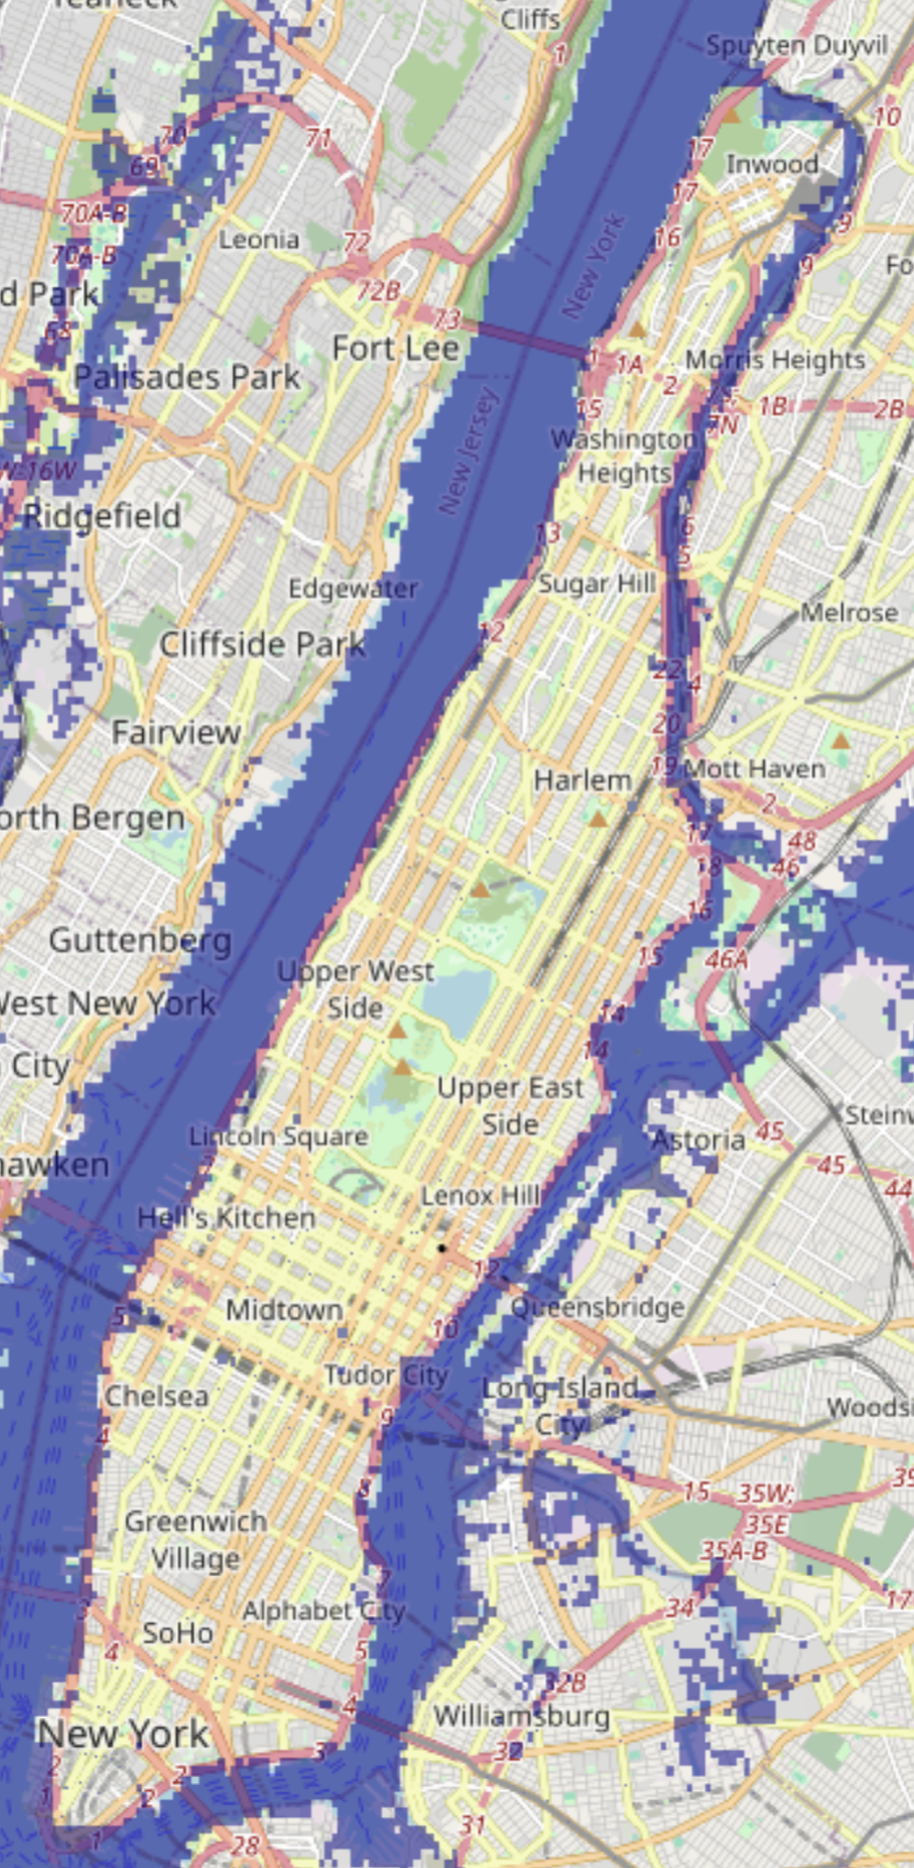
For another example:
No one seems to care about the upcoming attack on the World Trade
Center site. Why? Because it won’t involve villains with box cutters. Instead,
it will involve melting ice sheets that swell the oceans and turn that
particular block of lower Manhattan into an aquarium.
The odds of this happening in the next few decades are better
than the odds that a disgruntled Saudi will sneak onto an airplane and detonate
a shoe bomb. And yet our government will spend billions of dollars this year to
prevent global terrorism and … well, essentially nothing to prevent global
warming. (“If only gay sex caused global warming,” op-ed by Harvard psychology
professor Dan Gilbert, Los Angeles Times)
The sixth IPCC report projects, for the high emissions scenarios, sea level
rise by 2300, almost 300 years from now, of two to seven meters. The World
Trade Center site is 12 meters above sea level.
Popular talk about warming, again in my experience, is
usually put in terms more apocalyptic than the IPCC's upper estimate of four
degrees Celsius by 2100, roughly the current
difference between Wisconsin and Ohio. No newspaper I saw at the time
headlined its story on the fourth report with "Global Warming a Wet
Firecracker, International Panel finds temperature and sea level effects over
the next century real but small."
Anthropogenic warming remains a relatively small contributor
to the overall magnitude of any individual short-term event because its
magnitude is small relative to natural random weather variability on short time
scales. Because of this random variability, weather events continue to occur
that have been made less likely by human influence on climate, such as extreme
winter cold events ...
Contrast the final sentence to occasional claims that recent unusual cold is
evidence for, not against, climate change.
While only a few recent species extinctions have been
attributed as yet to climate change (high confidence), natural global climate
change at rates slower than current anthropogenic climate change caused
significant ecosystem shifts and species extinctions during the past millions
of years.
The
observation that species have gone extinct in the past over very long time
periods for reasons unrelated to human action has been converted into warnings
about large numbers of species being driven to extinction by anthropogenic
climate change.
Some low-lying developing countries and small island states
are expected to face very high impacts that, in some cases, could have associated
damage and adaptation costs of several percentage points of GDP.
Compare costs of several percentage points of GDP in the places most at risk
due to sea level rise with the rhetoric of hundreds of millions of climate
refugees, drowned island chains, and the like. For two more passages that
contradicted the popular view:
There is no evidence that surface water and groundwater
drought frequency has changed over the last few decades, although impacts of
drought have increased mostly due to increased water demand.
Economic losses due to extreme weather events have increased
globally, mostly due to increase in wealth and exposure, with a possible
influence of climate change (low confidence in attribution to climate change).
I have been contrasting the contents of the IPCC reports to popular views of
the dangers of climate change. The problem is mostly the fault of the media but
the IPCC, in particular the Summary for Policy Makers that accompanies each
report, sometimes encourages a misreading of the scientific results in the
alarmist direction not by what they say so much as by how they say it.
Climate change has negatively affected wheat and maize yields
for many regions and in the global aggregate (medium confidence). Effects on
rice and soybean yield have been smaller in major production regions and
globally, with a median change of zero across all available data …13
That does not say that yields have fallen, although that is what a careless
reader is likely to think, only that they are lower in some areas than they
would have been without climate change. A little searching finds a scholarly
article on wheat yields from 2012 which reported that
Wheat yields have increased approximately linearly since the
mid-twentieth century across the globe, but stagnation of these trends has now
been suggested for several nations. .... With the major exception of India, the
majority of leveling in wheat yields occurs within developed nations—including
the United Kingdom, France and Germany—whose policies appear to have
disincentivized yield increases relative to other objectives. The effects of
climate change and of yields nearing their maximum potential may also be
important....
Near the time that
leveling is generally observed, the European Union shifted away from a policy
that rewarded high agricultural production through price guarantees to a policy
that pays flat subsidies that do not increase with production and triggers
taxes when production limits are exceeded
What has happened is not that yields have decreased but that in some areas
they have stopped increasing, at least in part due to changes in agricultural
policy.
At present the world-wide burden of human ill-health from
climate change is relatively small compared with effects of other stressors and
is not well quantified. However, there has been increased heat-related and
decreased cold-related mortality in some regions as a result of warming ... .
The first sentence makes it sound as though climate change is making things
worse. The second implies that there have been both costs and benefits and
offers no estimate of their relative size. In fact, a study estimating the effect of warming on temperature
related mortality concluded that:
Importantly, cold-related death decreased 0.51 per cent from
2000 to 2019, while heat-related death increased 0.21 per cent, leading to a
reduction in net mortality due to cold and hot temperatures. (news story from Monash University)
The headline and first sentence of the story:
World’s largest study of global climate related mortality
links 5 million deaths a year to abnormal temperatures
More than five million extra deaths a year can be attributed
to abnormal hot and cold temperatures, according to a world first international
study led by Monash University.
That makes it sound as though climate change made things
worse; you had to read down to the sixth paragraph to discover that, according
to the study, the opposite was true; mortality due to abnormal temperature had
been decreased by climate change.
People who are socially, economically, culturally,
politically, institutionally, or otherwise marginalized are especially
vulnerable to climate change.
That is designed to imply that preventing climate change is particularly
important because the victims are people we feel sympathy for. It also implies,
however, that keeping poor countries poor by pressuring them to produce less
energy or produce it in ways that produce less CO2 but are more
expensive might decrease the amount of climate change but, by keeping them
poor, increase the damage it does.
Impacts from recent climate-related extremes, such as heat
waves, droughts, floods, cyclones, and wildfires, reveal significant
vulnerability and exposure of some ecosystems and many human systems to current
climate variability.
Climate-related extremes are not limited to those due to climate change.
Floods, cyclones, et. al. do damage...and always have.
For the major crops (wheat, rice, and maize) in tropical and
temperate regions, climate change without adaptation is projected to
negatively impact production for local temperature increases of 2°C or more
above late-20th-century levels, ...17
Emphasis mine. If farmers ignore the implications of climate change for what
crops they should grow and how to grow
them and continue to ignore them for the next sixty years or so, output is
expected to decline. I discussed the point at greater length in Chapter 5.
With these recognized limitations, the incomplete estimates
of global annual economic losses for additional temperature increases of ~2°C
are between 0.2 and 2.0% of income (±1 standard deviation around the mean)[18
Increase of global mean surface temperatures for 2081–2100
relative to 1986–2005 is projected to likely be in the ranges derived from the
concentration-driven CMIP5 model simulations, that is, 0.3°C to 1.7°C (RCP2.6),
1.1°C to 2.6°C (RCP4.5), 1.4°C to 3.1°C (RCP6.0), 2.6°C to 4.8°C (RCP8.5).[19
The report is from 2014, by which time global temperatures were higher than
the 1986-2005 average by about .31°C. Reducing the figures in the second
paragraph by that to fit the “additional temperature increases” of the first
paragraph, it implied that we were unlikely to experience much more than 2°C of
additional warming by 2100 in any but RCP8.5, originally proposed as an upper
bound on how bad climate change could be. If policies to prevent warming
reduced the annual growth rate of world income from (say) 2% to 1.98%, the
resulting loss would just about cancel the gain. That is not a compelling
argument for switching from fossil fuels to solar power.
The title of the story was "Watch out: Mammals
shrink when Earth heats up, study says." The story reported evidence
that, at a period when global temperatures were high, a number of ancient
mammals became smaller, by fourteen percent in one case, by four percent in
another.
There were two things wrong with the story. The first was the repeated use
of the term "shrinking." What it was describing was evolutionary
change over a period of several million years. The wording made it sound as
though animals were actually shrinking and that is how I would expect a casual
reader without much scientific background to read it. How else would you
interpret:
At least twice before in Earth's history, when carbon dioxide
levels soared and temperatures spiked, mammals shriveled a bit in size.
The second was the picture that accompanied the story. It shows a modern
horse, a Morgan, contrasted with Sifrhippus sandrae. The visual
impression is of enormous shrinkage, the modern horse being nearly a hundred
times the weight of the ancestral horse. But the change was happening many
millions of years before there were any modern horses.
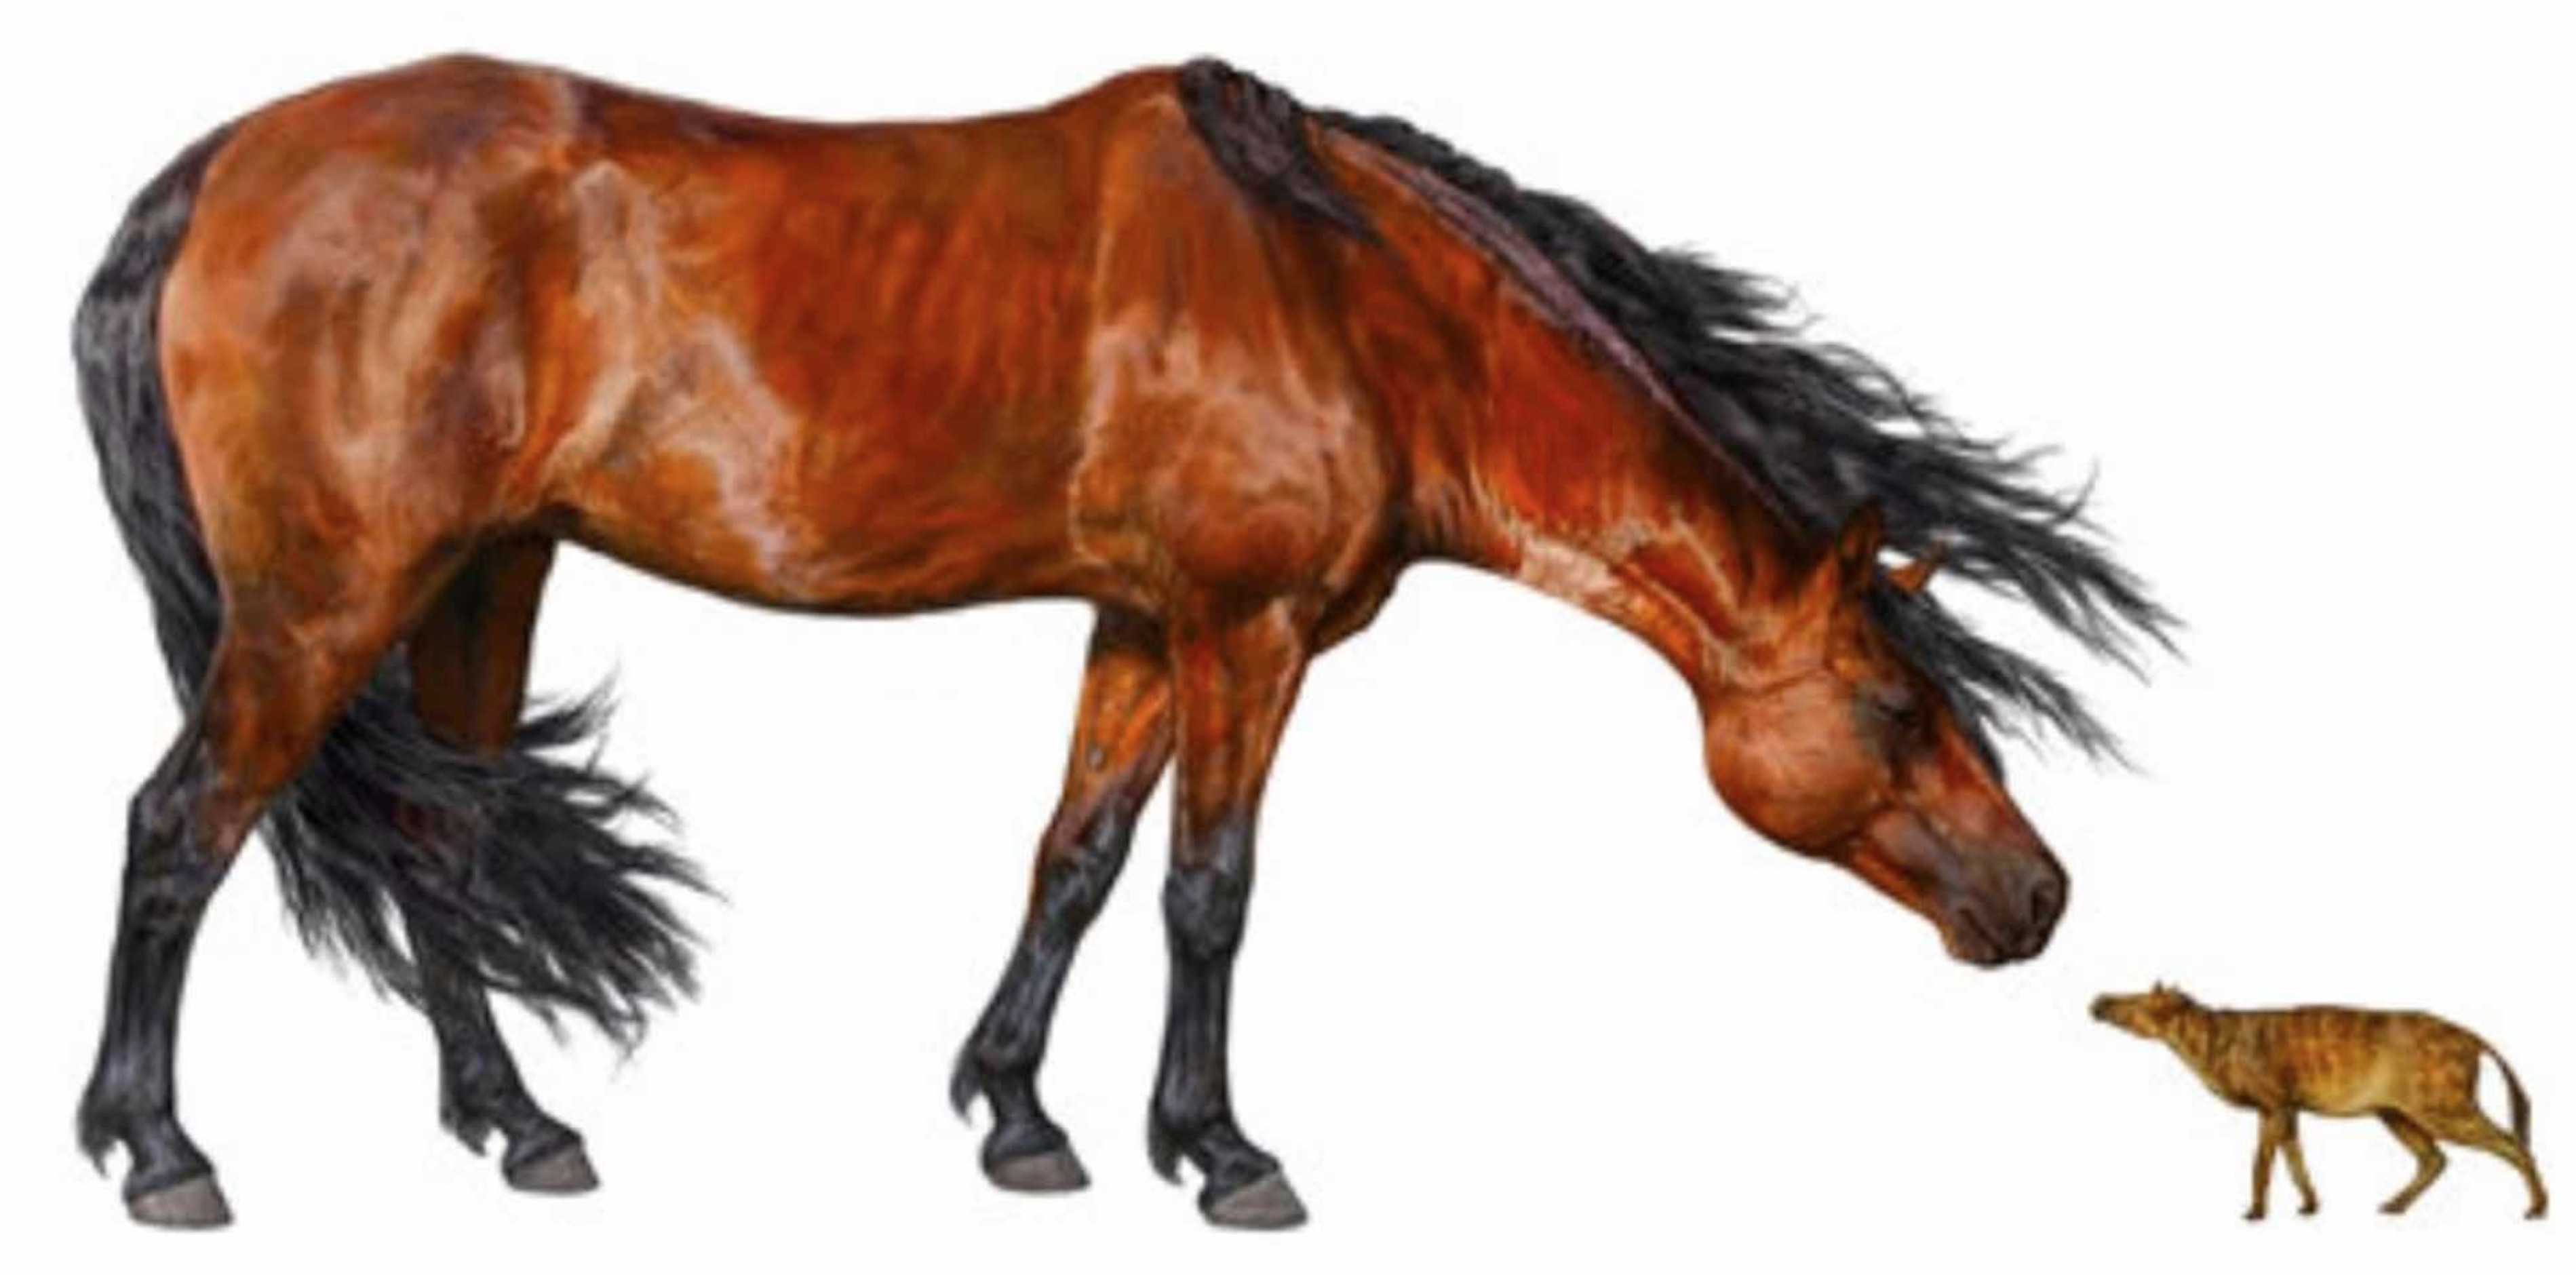 My conjecture is that the article
was designed to scare casual readers about the effects of global warming, to
make them imagine that it would shrink them by a similar amount. It is possible
that I am mistaken, that the author did not care about politics and was merely
trying to write a story people would read. Shrinking from the size of a horse
to the size of a cat is a much more dramatic story than evolutionary change of
an ancestral horse from the size of a large cat to the size of a medium cat,
which is what the article on which the story was based was describing.
My conjecture is that the article
was designed to scare casual readers about the effects of global warming, to
make them imagine that it would shrink them by a similar amount. It is possible
that I am mistaken, that the author did not care about politics and was merely
trying to write a story people would read. Shrinking from the size of a horse
to the size of a cat is a much more dramatic story than evolutionary change of
an ancestral horse from the size of a large cat to the size of a medium cat,
which is what the article on which the story was based was describing.
The pH of water is a measure of how basic or acidic it is. Pure water is
neutral, has a pH of 7, meaning that it has an equal number of H+ and OH- ions,
produced by the disassociation of water molecules: H2O → OH- + H+.
Water with more OH- than H+ is basic, pH>7, water with more H+ is acidic,
pH<7. Sea water is basic, with a pH of about 8.1, down from about 8.2 two
hundred years ago. It is getting gradually less basic by having CO2
molecules dissolved in it.
Referring to the process as acidification is technically correct but
misleading, since lowering the pH of ocean water with a pH of 8.1 moves it
towards neutral; only past 7 does it become acidic. At the present rate of
decline, that would take almost seven hundred years. Strong acids are
dangerous, so “acidification” sounds scary. Neutralization does not sound
scary. That is a good reason to call pH reduction acidification if you want to
scare people.
Lowering the pH of the ocean might cause problems for oceanic organisms
adapted to their current environment but not because it makes ocean water
corrosive.
As evidence of the rhetorical use of “acidification” …
Parts of the Pacific, for instance, are already so acidic
that sea snails' shells begin
dissolving as soon as they're born. Meet the tiny, translucent "sea
butterfly," whose home is currently being transformed into an acid bath.”
(Vice, May 1, 2014)
It may well be true that pteropods function less well when their environment
becomes less basic — but not because they are now in an acid bath.
And here is another from the same source, still using “acidify” for its
misleading implication but adding some false factual claims.
The Last Time Oceans Got This Acidic This Fast, 96%
of Marine Life Went Extinct
(Vice,
4/9/2015)
Compare the headline to the first line of the story.
The greatest extinction event in the history of the planet
was driven by oceans acidifying about as fast as they are today.
There is a difference between “got this acidic” and “acidifying about as
fast.” CO2 release during the Permian-Triassic extinction, which is
the event the story is talking about, was at a rate comparable to current CO2
release but it went on for about ten thousand years, as did the resulting
reduction in ocean pH (“acidification”) described in the article that the story
links to. The total amount of CO2 released was about a hundred times
the amount we can be expected to release over the next century or so,
much more than would be released by burning all known fossil fuels.
Both the title of the story and the first line are false, but in opposite
directions. The article linked to estimates the change in pH as .6-.7 over
about 10,000 years, or about .0006-7 per decade. The IPCC estimates current pH
change as about .016/decade, more than ten times as fast but, so far, for a
much shorter time. The article does not give a figure for pH, only for change
in pH, so does not say whether the ocean was “this acidic,” but the total
change it estimates is six to seven times the decrease in pH over the past two
centuries.
In one climate thread online some years ago I was
informed, by three different people, that global warming would:
Create two billion climate refugees
Flood most of the world's large cities
Destroy civilization.
The simplest rebuttal to such claims was the latest IPCC report, which at
the time was the fifth. The IPCC, which had been doing its best to persuade
people to support action to slow global warming, was unlikely to minimize the
problem. But if you looked not at the rhetoric but at the factual claims the
impending climate catastrophe looked like a wet firecracker.
The same evidence can be used against nuts on the other end of the spectrum,
such as the gentleman in one thread who claimed that the IPCC had a budget in
excess of twelve billion dollars. Pointing out to him that the actual budget,
available on the web, came to about eleven million dollars had no effect. If,
as he confidently believed, the IPCC is a massive fraud, inventing global
warming out of thin air for its own sinister purposes, why should we be so
naive as to believe their account of their budget? Pointing to webbed data on
global temperature, which had increased by about one degree C since 1910, would
be no more effective since he can, and probably would, claim that the data are
fake.
What he could not explain away so easily was the modesty of the IPCC's
claims. If they are trying to scare people into doing something about global
warming and if, as he believes, they are unconstrained by actual evidence and
science, why don't they tell a better story? Two degrees of warming over the
next 86 years, a foot or two of sea level rise, are not very impressive
threats, despite all the rhetorical efforts of the IPCC and its supporters. Why
don't they make it ten degrees and ten feet? Twenty feet? A hundred feet? Why
don't they tell something closer to the story that their supporters want to
believe?
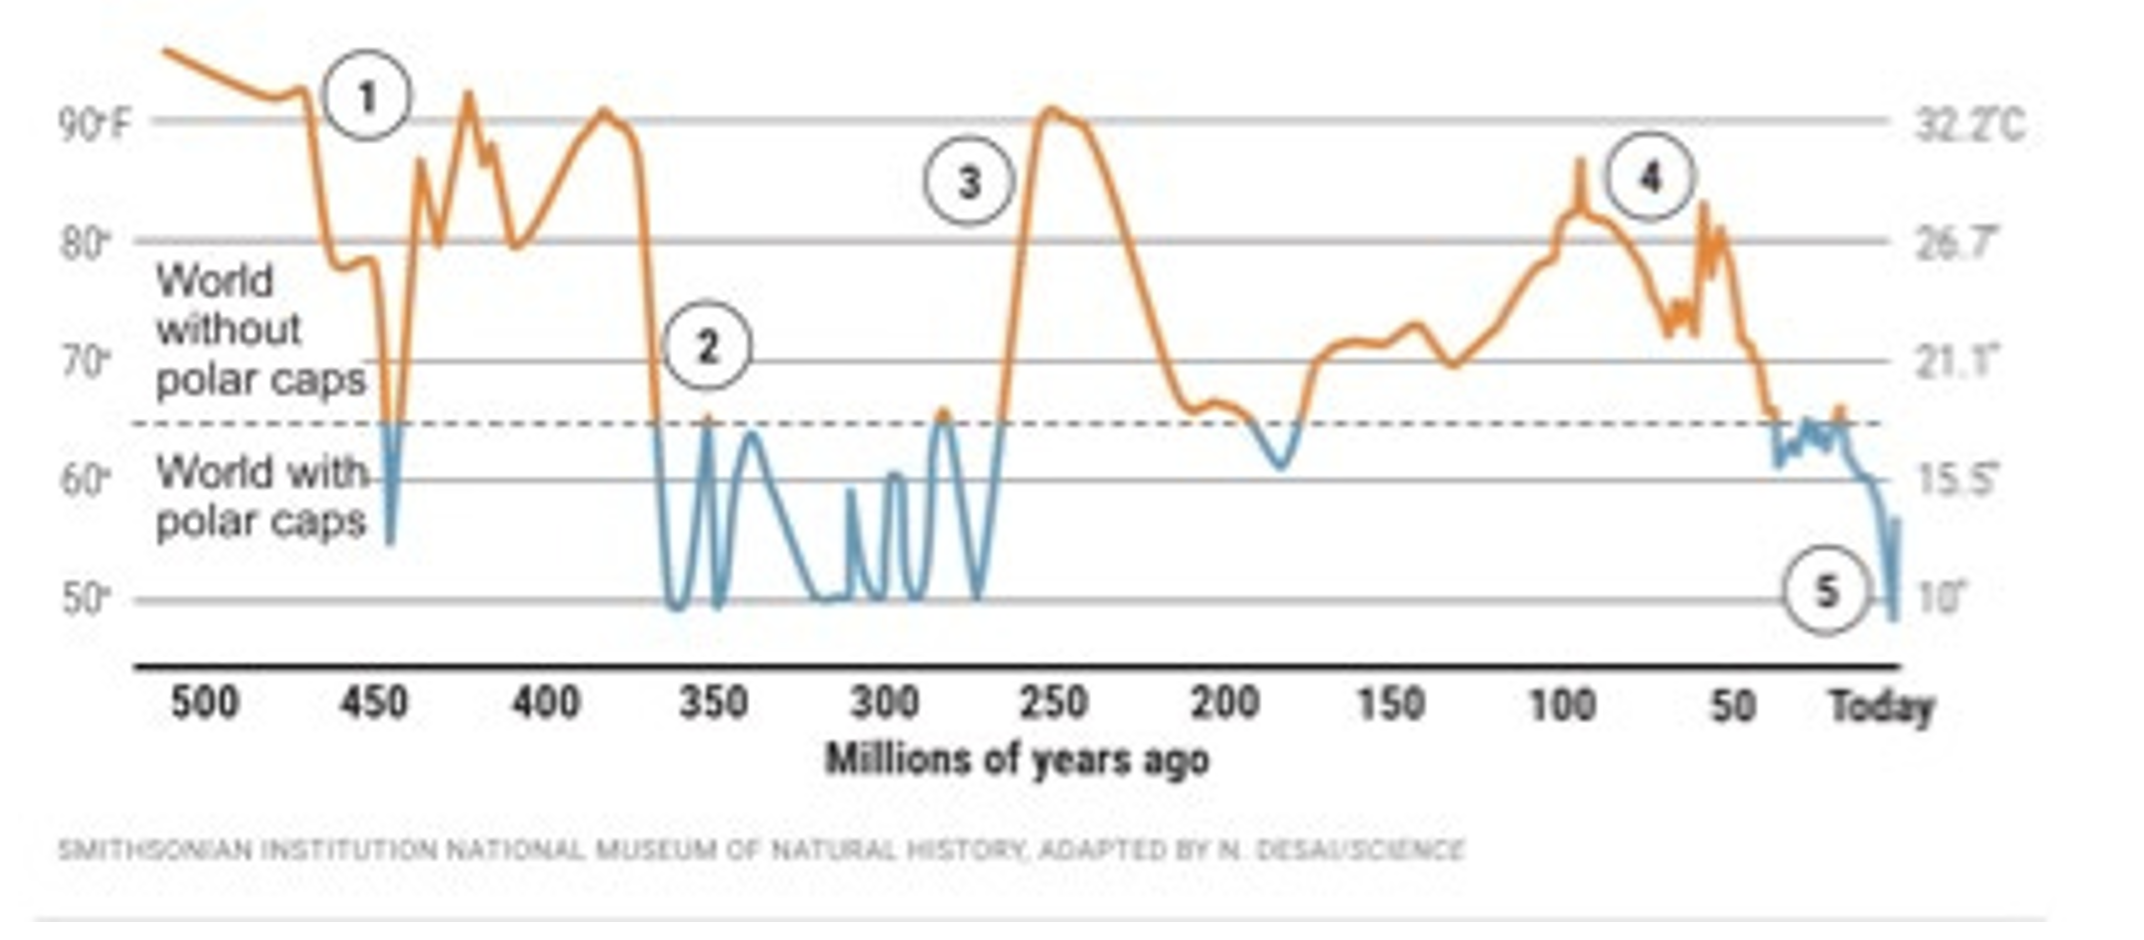 The graph shows that while global
temperature is currently rising, it is still well below what it was for most of
the past two hundred and fifty million years and would have to rise by another
13°C to get back to the peak level of about sixty million years ago.
The graph shows that while global
temperature is currently rising, it is still well below what it was for most of
the past two hundred and fifty million years and would have to rise by another
13°C to get back to the peak level of about sixty million years ago.
The headline of the news
story I found the graph in:
A 500-million-year survey of Earth's climate reveals dire warning
for humanity
If life gives you peaches, make cyanide from the pits.
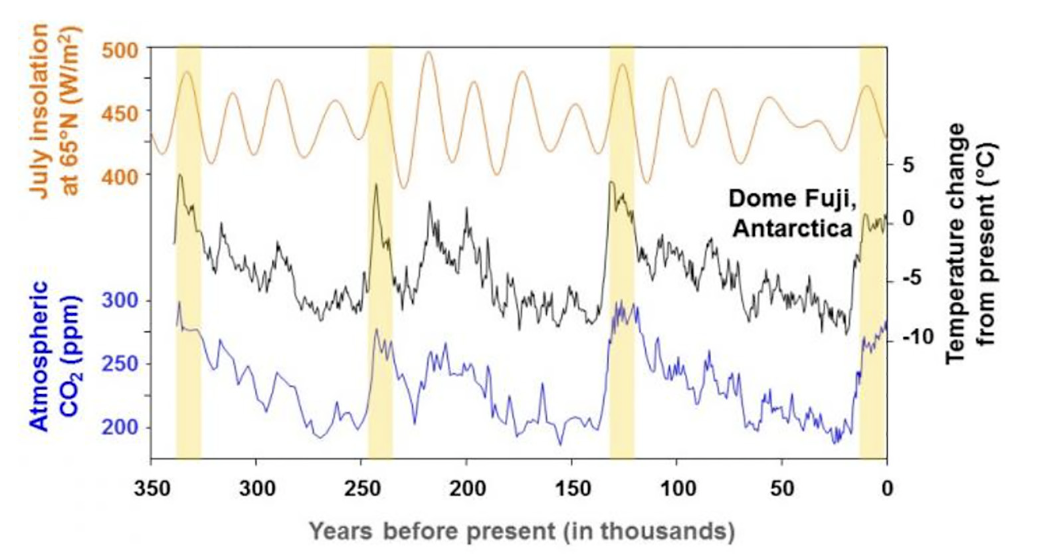
The figure shows temperature, CO2
concentration and insolation for the past 350,000 years, a period that covers
four interglacials, shown as yellow columns. The last is ours. In the first
three, temperature follows the same pattern, rising steeply at the beginning
then falling until the end. CO2 concentration follows a similar
pattern except in the third interglacial, where it oscillates about a constant
or slightly rising level.
The pattern in the fourth interglacial is quite different. For the first few
thousand years it looks like the previous three then the pattern reverses, with
temperature and CO2 rising instead of falling through the rest of
the interglacial.
What was different this time? The obvious guess is us. The reversal in the
pattern happens at about the time that humans adopted agriculture, resulting in
a large increase in human population and a change in how humans affected the
world around them.
That possibility occurred to me when I first saw the graph but I did not
know enough to tell if it was plausible, if anything humans did prior to recent
centuries was large enough to affect global temperature and CO2
levels. Someone in an online discussion pointed me at the work of William
Ruddiman, who noticed the pattern some twenty years before I did and published
on it, proposing what became known as the Early Anthropogenic Hypothesis. His
conjecture was that deforestation, starting about eight thousand years ago, had
put enough CO2 into the atmosphere to raise global temperatures.
Data on the concentration of methane, another greenhouse gas, showed a similar
divergence from the pattern of previous interglacials starting about five
thousand years ago. He attributed that to the development and spread of
irrigated rice farming, methane being produced by drowned vegetation. The
comparison between what happened in the current interglacial and in previous
interglacials is shown for CO2 in Figure A, for CH4 in figure
B.

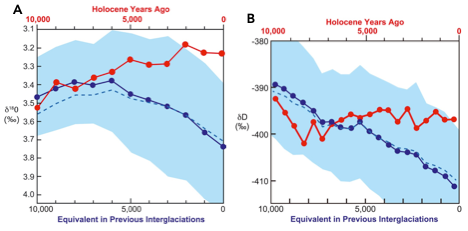
Comparison of Holocene trends (red) to stacked averages for
previous interglaciations (blue), from Ruddiman
et al. (2016) Figure 3. (A) Benthic ∂18O
stack from Lisiecki
and Raymo (2005) and B). Dome C ∂D stack from Jouzel
et al. (2003).
His conclusion:
This comparison thus suggests that a glaciation should have
begun several thousand years ago in northeast Canada. Early anthropogenic
emissions of CO2 and CH4 are the most likely reason that
it did not. (Ruddiman 2003, p. 288)
In addition to offering an explanation for the broad pattern, Ruddiman
argues that human influence on climate explains climate changes in the
historical past, with the reduction in global population due to pandemics such
as the black death causing large scale abandonment of farmed or grazed land
which then reforested, pulling CO2 out of the atmosphere and causing
a temporary drop in its global concentration.
Ruddiman’s paper set off a controversy that is still running. Inputs to the
controversy included archaeological evidence on the size of early populations,
pollen evidence for the extent of forests, climate modeling, isotope ratio
evidence for the sources of atmospheric CO2 and much else.
Alternative explanations for the pattern were rejected by supporters of the
hypothesis primarily on the grounds that they would have applied to earlier
interglacials. Interested readers will find a summary of the state of the
argument as of 2020 in the review article by Ruddiman et. al.
Its updated version of the hypothesis, which has the CO2 rise
starting about seven thousand years ago, includes a variety of complications,
none of which change the essential features of the conjecture.
The evidence from MIS 19 [an earlier interglacial whose
circumstances closely match the current one] suggests that human interference
in the operation of the climate system by greenhouse-gas emissions during the
Holocene kept ice from accumulating in north-polar regions. The late Holocene
was a time in which interglacial warmth persisted only because of early
farming. (Ruddiman et. al. 2020)
One of my criticisms of estimates of the net effect of climate change, in
particular the estimates by Nordhaus, is that they include estimates of the
expected cost due to low probability high cost consequences of climate change,
things that probably won’t happen but would be very bad if they did, but not of
low probability high cost consequences of preventing climate change. The
obvious example of the latter is the end of the current interglacial. It has
been running longer than most past interglacials and, although we have theories
about why interglacials start and end, we do not actually know. We do know the
consequences, on the basis of past glaciations — about half a mile of ice over
the present locations of Chicago and London and a drop of sea level by several
hundred feet, leaving every port in the world high and dry. That would be a
very large cost. If Ruddiman is correct, that particular danger has been
eliminated by anthropogenic warming in the distant past.
But he might not be.
Implications of
Academic Dishonesty
There was a substantial flap back in 2014 over the
appearance online of a video
of Jonathan Gruber telling the truth about the Obamacare bill:
This bill was written in a tortured way to make sure CBO did
not score the mandate as taxes. If [Congressional Budget Office] scored the
mandate as taxes, the bill dies. Okay, so it’s written to do that. In terms of
risk-rated subsidies, if you had a law which said that healthy people are going
to pay in -– you made explicit that healthy people pay in and sick people get
money — it would not have passed… Lack of transparency is a huge political
advantage. And basically, call it the stupidity of the American voter, or
whatever, but basically that was really, really critical for the thing to pass.
And it’s the second-best argument. Look, I wish Mark was right that we could
make it all transparent, but I’d rather have this law than not.
What he is saying, pretty clearly, is that he wishes one
could both be honest and get good legislation passed but approves of dishonesty
if necessary to get the job done.
My guess is that his view is shared not only by most
politicians but by most academics involved in the political system, although I
expect many would be unwilling to say so, especially on camera. Part of the
reason I believe that is an experience that happened almost fifty years ago. I
was spending a summer in Washington as a congressional intern. My congressman
lent me for four days a week to the Joint Economic Committee. They lent me to
the Project on State and Local Finance of George Washington University, aka the
Project on State and Local Finance of the JEC, aka the Project on State and
Local Finance of the Governors' Conference. The Project was producing a fact
book, a volume to provide the ordinary voter with information on state and
local finance.
I discovered a fact. It was a demographic fact about people
already born. It was a fact about future financial requirements for the largest
expenditure in state and local budgets. The people running the project refused
to include the fact in their factbook, not because they thought it was not true
or not important but because it pointed in the wrong direction. Knowing it
would make voters less willing to support increases in state and local
revenues, which was the opposite of the result they wanted.
The fact itself is one you can easily check. The date was
about 1967. For the previous fifteen or so years, as the baby boom came into
the school system, the ratio of students to taxpayers had been going up, which
meant that taxes for schools had to increase in order to keep per pupil
spending from falling. For the next decade or two, as the baby boom came out of
the schools and into the labor force, the ratio of students to taxpayers would
be going down. That meant that per pupil spending could be kept at its current
level while taxes for schools went down. Schooling was and is the largest
expenditure of state and local governments.
I had assumed that professional academics, people I liked
and respected, were committed to honesty in their professional work. I think of
the discovery that they were not as my loss of innocence.
My gut reaction is to disapprove both of what the people I
worked with then did—pretending to inform people while deliberately
misinforming them—and what Gruber describes and approves of, but I cannot prove
that my reaction is justified. Gruber's position is that he is willing to
sacrifice one value for another that he thinks more important, and I cannot
show that he is wrong. I can, however, point out a danger in the approach. Once
academics accept the principle that dishonesty is justified if done for the
greater good, their work cannot be trusted on any subject with regard to which
they have an incentive to misrepresent it.
Consider the relevance for the current climate controversy.
No single academic knows enough to base his conclusion solely on his own work
and expertise. Each of them is relying on information produced by many others.
The economists estimating the net effect of AGW rely on the work of climate
scientists predicting the effects on temperature of increased CO2, the work of
other climate scientists predicting the effect of increased temperature on
rainfall, hurricanes, and other relevant variables, the work of agronomists
estimating the effect of changes in CO2 concentration, length of growing
season, temperature on agricultural production, the work of statisticians
confirming the models of the climate scientists on the basis of their analysis
of paleoclimate data, and many others.
What happens if each of those experts feels entitled, even obligated, to lie
just a little, to shade his conclusions to strengthen the support they provide
for what he believes is the right conclusion? Each of them then interprets the work
of all the others as providing more support for that conclusion than it really
does. The result might be that they end up biasing their results in support of
the wrong conclusion—which each of them believes is right on the basis of the
lies of all the others.
That is one of the reasons I am not greatly impressed by the
supposed scientific consensus in favor of Catastrophic Anthropogenic Global
Warming.
There is a quote usually attributed to Bismarck but
apparently due to Saxe:
Laws, like sausages, cease to inspire respect in proportion
as we know how they are made.
Science too. At least when it intersects politics.
Discussed under the subhead “And Nutrition” in Chapter 5.
Nordhaus gets his figure from Table 5-1 of his book A
Question of Balance. So far as I can tell he never says how long a period
he is summing the cost over, but the first line of the table shows the results
of doing nothing for 250 years, so it is presumably at least that long. For
simplicity I am assuming that global GNP increases at the discount rate, making
the present value of 250 years of global GNP equal to 250 times GNP in the
first year.
My source for the details of the history is W. Allen
Wallis, “The Statistical Research Group, 1942-1945,” Journal of the American
Statistical Association, Jun., 1980, Vol. 75, No. 370, pp. 320-330. Reading
it, I came across the following passage by Wallis:
“He brought up the problem of
the necessary sample size for comparing two percentages and gave me a
memorandum prepared for him on that subject by a certain John von Neumann. I
had never before heard of this von Neumann fellow, but the memorandum was
obviously pretty smart for a man who apparently knew little about statistics”
Al Gore, to his credit, has publicly
conceded both that the biofuels
policy he supported was a mistake and that "One of the reasons I made that
mistake is that I paid particular attention to the farmers in my home state of
Tennessee, and I had a certain fondness for the farmers in the state of Iowa
because I was about to run for president."
This and other references to IPCC figures are to IPCC
AR6 WGI Full Report.
SAS, EAS, SEA, and CAF in the table.
“The Arctic is projected to experience the highest
increase in the temperature of the coldest days, at about 3 times the rate of
global warming (high confidence).” (IPCC AR6 WGI)
Ramankutty et. al. says they included the effect of
CO2 fertilization. I determined that the other two did not by correspondence
with the authors.
The problem was recognized in Lobell et. al. 2011: “Since our models are non-linear, both year-to-year variations in
historical weather as well as the average climate are used for the
identification of the coefficients (unlike a linear panel which only uses
deviations from the average). However, we do not directly estimate the full set
of adaptation possibilities that might occur in the long-term under climate
change.”
I am oversimplifying in two respects. The closer land
is to the pole, the more it warms — arctic temperatures go up by about three
degrees for every degree increase in global temperatures. And the closer to the
pole you are, the shorter the distance around the world at that latitude. Both
effects mean that you lose slightly more land in a given temperature range than
you gain, all else held constant.
One commenter on my blog pointed out two other
effects, working in opposite directions. The closer you are to the pole the
less intense the sunlight, because it is coming in at a greater angle. On the
other hand, the closer you are to the pole the longer the day in the summer,
which is when it matters for crop growth. Since three hundred miles is only
about one twentieth the distance from the equator to the pole, I would expect
both effects to be small.
A few plants, such as pineapple, use a third
mechanism, Crassulacean acid metabolism, to deal with lack of water. Some use only CAM,
others switch from CAM to C3 or C4 when water supply is adequate.
According to Kimball 2016,
yields of C3 grain crops were increased on average about 19% by increasing CO2
from 353 ppm to 550. Since “to a first approximation growth responses by plants
to elevated CO2 are generally linear between 300 and 900 ppm” that implies a
23% increase for a doubling.
some
of the same authors makes that explicit: "we believe the simplest approach
is to model diets that are unchanged with respect to calories and
composition."
Neither article shows the average temperature of the
cities. I used Temperature data from University of East Anglia Climatic
Research Unit; Harris, I.C.; Jones, P.D.; Osborn, T. (2022): CRU TS4.06:
Climatic Research Unit (CRU) Time-Series (TS) version 4.06 of high-resolution
gridded data of month-by-month variation in climate (Jan. 1901- Dec. 2021).
NERC EDS Centre for Environmental Data Analysis, date of citation. https://catalogue.ceda.ac.uk/uuid/e0b4e1e56c1c4460b796073a31366980
In some cases the adjusted temperature is below the
unadjusted temperature for the next lower RCP, so I have to use the linear
combination of unadjusted temperatures for the next lower RCP and the one below
it. For the lowest RCP, RCP2.6, I calculated the corrected mortality as
uncorrected mortality times corrected temperature change/uncorrected
temperature change.
I have cut off the top part of the figure which shows atmospheric CO2
concentration over time.
For an extended demonstration, see my Future Imperfect, which discusses implications of technological
revolutions that could happen over the next few decades.
A commenter on my blog pointed at a revised
version of the cartoon, designed to
make the point by offering the same approach in a different context.
I have proposed a
similar explanation for the popularity of Tolkien’s Lord of the Rings.
Parry et. al. Op. Cit. p. 12
Parry et. al. Op. Cit. p. 14
Stocker, T.F. et. al., IPCC, 2013: Climate Change
2013: The Physical Science Basis. Contribution of Working Group I to the Fifth
Assessment Report of the Intergovernmental Panel on Climate Change, Chapter 10,
p. 916.
“Climate change threatens one in six species with
extinction, study finds” (Carbon Brief,
2015)
Dan Rothman of the department of Earth, Atmospheric
and Planetary Sciences (EAPS) at MIT said:
“The rate of injection of CO2 into
the late Permian system is probably similar to the anthropogenic rate of
injection of CO2 now. It’s just that it went on for 10,000 years.” (Earthsky,
November 25, 2011)
“An acidification event of ~10,000 years is
consistent with the modeled time scale required to replenish the ocean with
alkalinity, as carbonate deposition is reduced and weathering is increased
under higher Pco2 and global temperatures.” (Clarkson et.
al., Ocean acidification and the Permo-Triassic mass
extinction,” Science vol.
348, 10 Apr 2015, pp. 229-232. This is the article linked to in the news
story.)
Dan Rothman, who calculated the average rate at which
carbon dioxide entered the oceans and atmosphere at the time, finding it to be
somewhat less than today’s influx due to fossil fuel emissions, said the total
amount of CO2 pumped into Earth’s atmosphere over this time period
was so immense that it’s not immediately clear where it all came from. He said:
“It’s just not easy to imagine. Even if you put all the world’s known coal
deposits on top of a volcano, you still wouldn’t come close. So something unusual
was going on.” (Earthsky
November 25, 2011)
“Specifically, the required model
perturbation of 24,000 PgC exceeds the ~5000 PgC of conventional fossil fuels
and is at the upper end of the range of estimates of unconventional fossil
fuels (such as methane hydrates). We show that such a rapid and large release
of carbon is critical to causing the combined synchronous decrease in both pH
and saturation state that defines an ocean acidification event.” (Clarkson et.
al., op. cit.)
On Google+, probably in 2014.
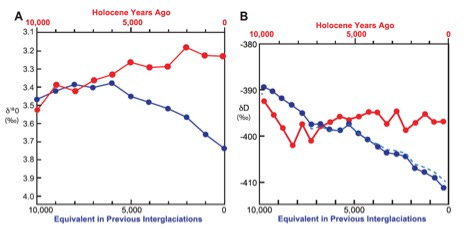